
1-click AWS Deployment 1-click Azure Deployment 1-click Google Deployment
Overview
WIRESHARK:
Wireshark is a network packet analyzer. A network packet analyzer offers taken packet data in as much detail .You could think of a network packet analyzer as a measuring device for examining what’s happening inside a network cable, just like an electrician uses a voltmeter for examining what’s happening inside an electric cable .In the past, such tools were either very expensive, proprietary, or both. However, with the advent of Wireshark, that has changed. Wireshark is available for free, is open source, and is one of the best packet analyzers available today. Wireshark is a software tool used to monitor the network traffic through a network interface. It is the most widely used network monitoring tool today. Wireshark is loved equally by system administrators, network engineers, network enthusiasts, network security professionals and black hat hackers. The extent of its popularity is such, that experience with Wireshark is considered as a valuable/essential trait in a computer networking related professional.
There are many reasons why Wireshark is so popular :
- It has a great GUI as well as a conventional CLI(T Shark).
- It offers network monitoring on almost all types of network standards (ethernet, wlan, Bluetooth etc)
- It is open source with a large community of backers and developers.
- All the necessary components for monitoring, analysing and documenting the network traffic are present.
It is free to use.
Wireshark and its Function as Sniffer
In places where multifaceted systems and technology are used, in addition to the level flow of processes and steps, the characteristic of system and network security is the importance of attention. When it concerns advancing industrial companies, own developments are often necessary, and their creation is usually documented on one or more computers. These sensitive data must be protected from hostile attacks, which resulted in establishing these so-called sniffer programs that allow tracking and analyzing the data flow in order to find possible error sources and discrepancies. This is where the Wireshark comes in, which is a tool serving specifically for the analysis of network-internal communication connections. This software is publicly available.
The Sniffer Software
Wireshark is a program that works with the sniffer software and thus checks the data traffic within a network for implausible distinctive features and discrepancies. Consequently, this tool is used for network analysis and to a certain extent guarantees the smooth flow of processes in a computer system by detecting errors. A sniffer treats two different modes:
- the non-promiscuous mode and
- the promiscuous mode.
In the first mode, the incoming and outgoing data traffic is checked on your own computer. However, in the promiscuous mode, the entire data traffic that is transferred to the powered network interface is saved. As a result, also those frames are recorded that are not addressed directly. The advantages of using such a sniffer software and ultimately the profit by using Wireshark are
- diagnosing network problems,
- uncovering hacker attacks,
- the network traffic analysis and
- filtering data according to suspicious content.
The History of the Wireshark Creation
This program was created based on the “General Public License” initiative, and under the management of Gerald Combs. Initially, Gerald Combs was employed at Ethereal Software Inc., and the tool was originally also known as Ethereal. In 2007, the first version was put on the market, and it is known today under its more common name “Wireshark”, as a free and open source software. Ethereal continues to be available on the market despite the fact that this predecessor is no longer being further developed. However, the basis on which both versions are working, are the network analysis products of commercial manufacturers. By now Version 1.8.5 is available, which can be used in the operating systems Unix, Linus, Solaris, Mac, and Windows. The program is not yet available in German.
Technical Details about Wireshark
While recording data traffic to a network interface, or after it is terminated, the collected data are made available as individual packets with this program. The purpose of the tool is to present the data clearly and to organize them so that a simple analysis is possible where people can logically trace the steps. With this structure in Wireshark, the collected recordings from the data traffic may be viewed and be broken down by content. Additionally, the many functions of the program allow preparing statistics about the data flow and extracting binary contents such as images.
The Mode of Action of Wireshark
The data, or here also data packets, are transferred via a network cable. The flow of data runs serial, so that the data are sent in bits strung together. The individual bits of the payload data are translated into corresponding voltage levels, so that these can be transferred to the corresponding cable. However, before the data reach the cable, each single layer of the seven layers of a protocol stack must be passed through. This happens in two simple steps:
- Encapsulation – each layer adds a specific header to the data
- Decapsulation – while passing through each layer, the header is removed again by the station for which the data are intended.
Wireshark is a program that is used to capture data packets to allow a more precise analysis. The main focus of this tool is observing the data traffic within a network. Such a tool allows the user to examine his/her own computer for protocol errors and problems within the network architecture. Accordingly, Wireshark is also gaining significance within the information technology and network-internal communication, because by finding discrepancies, risks to the PC and its components can be prevented. From a security aspect it must be taken into account that such a program is helpful in discovering and stopping hacker attacks. Especially among people working in the industry, this can be of an advantage if sensitive data is stored on their computer that should never reach third parties.
Wireshark, formerly known as Ethereal, can be used to examine the details of traffic at a variety of levels ranging from connection-level information to the bits that make up a single packet. Packet capture can provide a network administrator with information about individual packets such as transmit time, source, destination, protocol type and header data. This information can be useful for evaluating security events and troubleshooting network security device issues. Wireshark will typically display information in three panels. The top panel lists frames individually with key data on a single line. Any single frame selected in the top pane is further explained in the tool’s middle panel. In this section of the display, Wireshark shows packet details, illustrating how various aspects of the frame can be understood as belonging to the data link layer, network layer, transport layer or application layer. Finally, Wireshark’s bottom pane displays the raw frame, with a hexadecimal rendition on the left and the corresponding ASCII values on the right.Because Wireshark can also be used for overhearing, an organization using the tool should make sure it has a clearly defined privacy policy that spells out the rights of individuals using its network, grants permission to snuffle traffic for security and troubleshooting issues and states the organization’s policies for obtaining, analyzing and retaining network traffic samples. Wireshark is licensed under the GNU General Public License.
How to Use Wireshark to Capture, Filter and Inspect Packets

Wireshark, a network analysis tool formerly known as Ethereal, captures packets in real time and display them in human-readable format. Wireshark includes filters, color coding, and other features that let you dig deep into network traffic and inspect individual packets.. You can use Wireshark to inspect a suspicious program’s network traffic, analyze the traffic flow on your network, or troubleshoot network problem.
Getting Wireshark
You can download Wireshark for Windows or macOS from its official website. If you’re using Linux or another UNIX-like system, you’ll probably find Wireshark in its package repositories. For example, if you’re using Ubuntu, you’ll find Wireshark in the Ubuntu Software Center.Just a quick warning: Many organizations don’t allow Wireshark and similar tools on their networks. Don’t use this tool at work unless you have permission.
Capturing Packets
After downloading and installing Wireshark, you can launch it and double-click the name of a network interface under Capture to start capturing packets on that interface. For example, if you want to capture traffic on your wireless network, click your wireless interface. You can configure advanced features by clicking Capture > Options, but this isn’t necessary for now.

As soon as you click the interface’s name, you’ll see the packets start to appear in real time. Wireshark captures each packet sent to or from your system.If you have promiscuous mode enabled—it’s enabled by default—you’ll also see all the other packets on the network instead of only packets addressed to your network adapter. To check if promiscuous mode is enabled, click Capture > Options and verify the “Enable promiscuous mode on all interfaces” checkbox is activated at the bottom of this window.

Click the red “Stop” button near the top left corner of the window when you want to stop capturing traffic.

Color Coding
You’ll probably see packets highlighted in a variety of different colors. Wireshark uses colors to help you identify the types of traffic at a glance. By default, light purple is TCP traffic, light blue is UDP traffic, and black identifies packets with errors—for example, they could have been delivered out of order.To view exactly what the color codes mean, click View > Coloring Rules. You can also customize and modify the coloring rules from here, if you like.

Sample Captures
If there’s nothing interesting on your own network to inspect, Wireshark’s wiki has you covered. The wiki contains a page of sample capture files that you can load and inspect. Click File > Open in Wireshark and browse for your downloaded file to open one.You can also save your own captures in Wireshark and open them later. Click File > Save to save your captured packets.

Filtering Packets
If you’re trying to inspect something specific, such as the traffic a program sends when phoning home, it helps to close down all other applications using the network so you can narrow down the traffic. Still, you’ll likely have a large amount of packets to sift through. That’s where Wireshark’s filters come in.
The most basic way to apply a filter is by typing it into the filter box at the top of the window and clicking Apply (or pressing Enter). For example, type “dns” and you’ll see only DNS packets. When you start typing, Wireshark will help you autocomplete your filter.

You can also click Analyze > Display Filters to choose a filter from among the default filters included in Wireshark. From here, you can add your own custom filters and save them to easily access them in the future.

Another interesting thing you can do is right-click a packet and select Follow > TCP Stream.
You’ll see the full TCP conversation between the client and the server. You can also click other protocols in the Follow menu to see the full conversations for other protocols, if applicable.

Close the window and you’ll find a filter has been applied automatically. Wireshark is showing you the packets that make up the conversation.

Inspecting Packets
Click a packet to select it and you can dig down to view its details.

You can also create filters from here — just right-click one of the details and use the Apply as Filter submenu to create a filter based on it.

Wireshark is an extremely powerful tool, and this tutorial is just scratching the surface of what you can do with it. Professionals use it to debug network protocol implementations, examine security problems and inspect network protocol internals.
—
Wireshark is the world’s foremost network protocol analyzer. It lets you see what’s happening on your network at a microscopic level. It is the de facto (and often de jure) standard across many industries and educational institutions.
Wireshark is a free and open source packet analyzer. It is used fornetwork troubleshooting, analysis, software and communications protocol development, and education. Originally named Ethereal, the project was renamed Wireshark in May 2006 due to trademark issues.
Wireshark on Cloud runs on Amazon Web Services (AWS) and Google Cloud Platform (GCP) is used for network troubleshooting, analysis, software and communications protocol development and education.
Wireshark is owned by Wireshark (https://www.wireshark.org/) and they own all related trademarks and IP rights for this software.
Cognosys provides hardened images of Wireshark on all public cloud i.e. AWS marketplace and Google Cloud Platform (GCP).
Wireshark on Cloud for AWS
Features
Most commonly used features in Wireshark:
1)Working with packet streams
While working on network capture, there can be multiple instances of network activities going on. Consider a small example where you are simultaneously browsing multiple websites through your browser. Several TCP data packets will be flowing across your network for all these multiple websites. So it becomes a bit tedious to track the data packets belonging to a particular stream or session. This is where Follow TCP stream comes into action.Now when you are visiting multiple websites, each site maintains its own stream of data packets. By using the Follow TCP stream option we can apply a filter that locates packets only specific to a particular stream.
To view the complete stream, select your preferred TCP packet (for example, a GET or POST request). Right-clicking on it will bring up the option Follow TCP Stream.
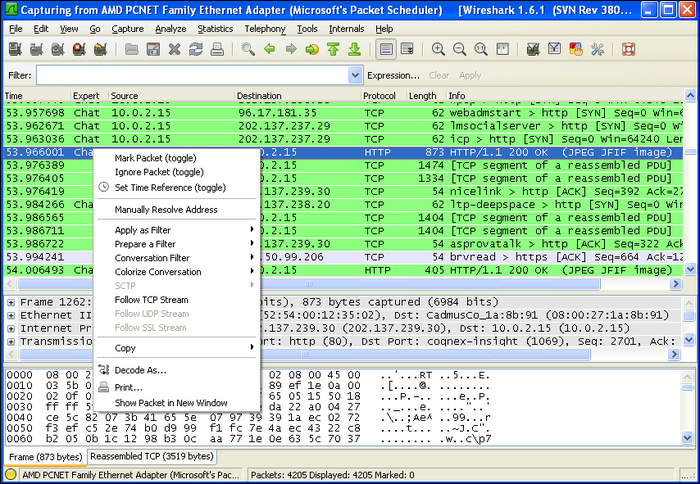
Once you click on Follow TCP Stream, you will notice that a new filter rule is applied to Wireshark and the main capture window reflects all those data packets that belong to that stream. This can be helpful in figuring out what different requests/responses have been generated through a particular session of network interaction. If you take a closer look at the filter rule applied once you follow a stream, you will see a rule similar to tcp.stream eq <Number>. Here Number reflects the stream number which has to be followed to get various data packets.
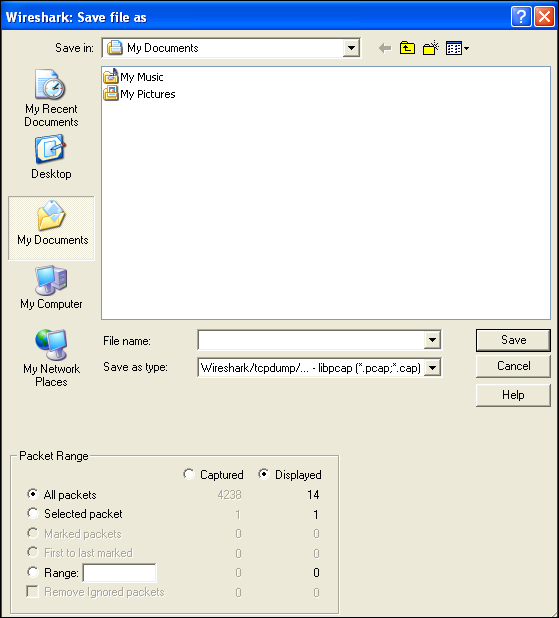
An additional operation that can be carried out here is to save the data packets belonging to a particular stream. Once you have followed a particular stream, go to File | Save As. Then select Displayed to save only the packets belonging to the viewed stream.
Similar to following the TCP stream, we also have the option to follow the UDP and SSL streams. The two options can be reached by selecting the particular protocol type (UDP or SSL) and right-clicking on it. The particular follow option will be highlighted according to the selected protocol.
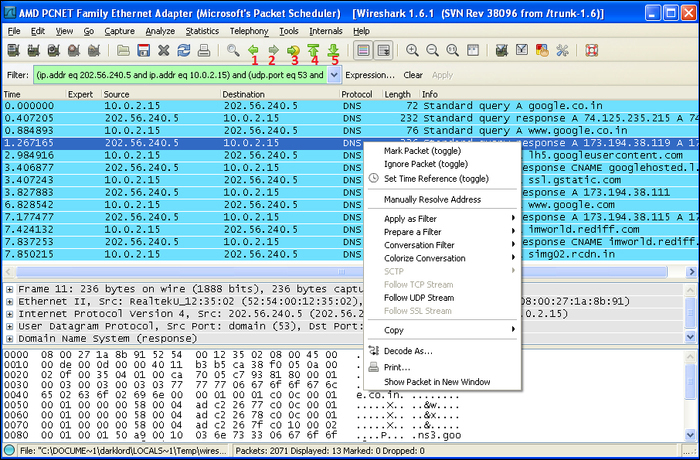
The Wireshark menu icons also provide some quick navigation options to migrate through the captured packets. These icons include:
- Go back in packet history (1): This option traces you back to the last analyzed/selected packet. Clicking on it multiple times keeps pushing you back to your selection history.
- Go forward in packet history (2): This option pushes you forward in the series of packet analysis.
- Go to packet with number (3): This option is useful in directly going to a specific packet number.
- Go to the first packet (4): This option takes you to the first packet in your current display of the capture window.
- Go to last packet (5): This option jumps your selection to the last packet in your capture window.
2)Decoding packets and exporting objects
Wireshark provides a very powerful feature of decoding the captured packets into user specified formats. The decode functionality of Wireshark temporarily diverts the specific protocol dissections. This process can be helpful in cases where the data is flowing over multiple ports or it is not recognized as a standard protocol. The decode functionality can be used to easily transform the packets into their original protocol.The decode functionality is a temporary action and the changes will be lost unless the decoded packets are saved separately.Right-clicking on a packet will reflect the option Decode as…. Clicking on it will open a box containing different tabs and related options.
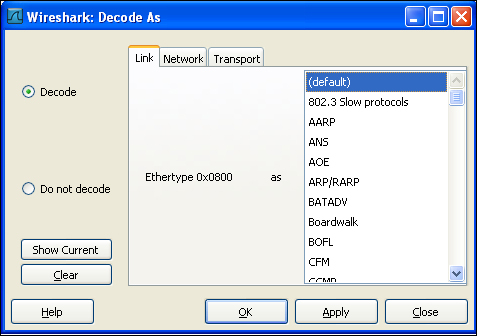
You will notice three different tabs at the top. Let us understand them one by one.
- Decode As Link: Selecting this tab will show different protocols at the data link layer. Choosing any of these protocols and selecting the Decode radio option will convert the specified packet into the user specified protocol.
- Decode As Network: This tab contains different network layer protocols such as TCP and UDP. It can be most useful in IPv4 to IPv6 conversion.
- Decode As Transport: This tab reflects the different transport layer protocols in which the data packet can be decoded.
You will also notice the Show Current button which shows the different user specified decodes.
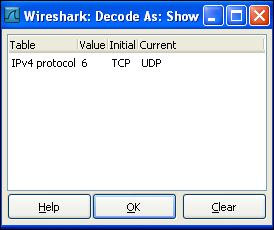
Clicking on Clear will remove all the packet decodes applied by the user. Clicking on the Apply button applies the current decode option and keeps the dialog box open for further operation.Moving ahead with another important discussion of this section, Wireshark also provides the feature to export different objects captured as packet streams. For example, downloading a flash will be seen in the form of packets in the capture window, but it can be exported as a standalone flash media by using the export feature. To view the different objects captured in an HTTP traffic, go to to File | Export | Objects | HTTP. This will open up a list of captured objects transferred as a part of HTTP traffic.
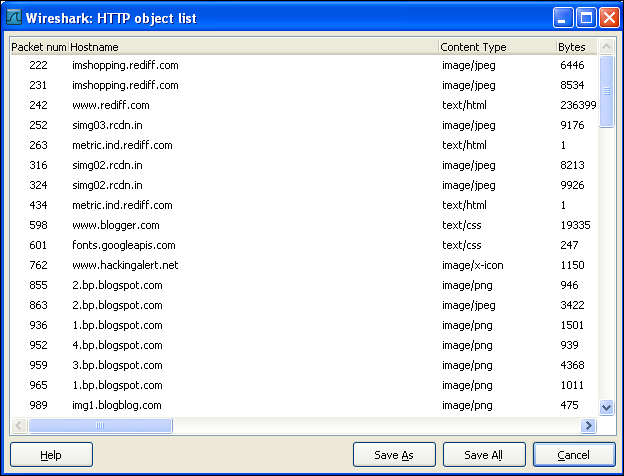
Selecting any of the object types and clicking on Save As will convert the packet capture into that object type. For example, selecting an image/JPEG file type and saving it will create a new image file on our local disk. This is a very efficient and quick way of retrieving different file types downloaded during packet capture.
3)Statistics of the captured packets
In this section we will take a detailed look at generating statistics for the captured packets in order to have an overview of our network activity. We have already covered I/O graphs in our previous section. Here we will uncover some more important aspects for generating quick statistics of network capture.The Statistics menu option of Wireshark provides some very cool statistical features that can be used to generate an overview of network activity. Here we will cover five important tools, namely Summary, Protocol Hierarchy, Conversations, Endpoint, and Flow Graph. Let us discuss each of them one by one.
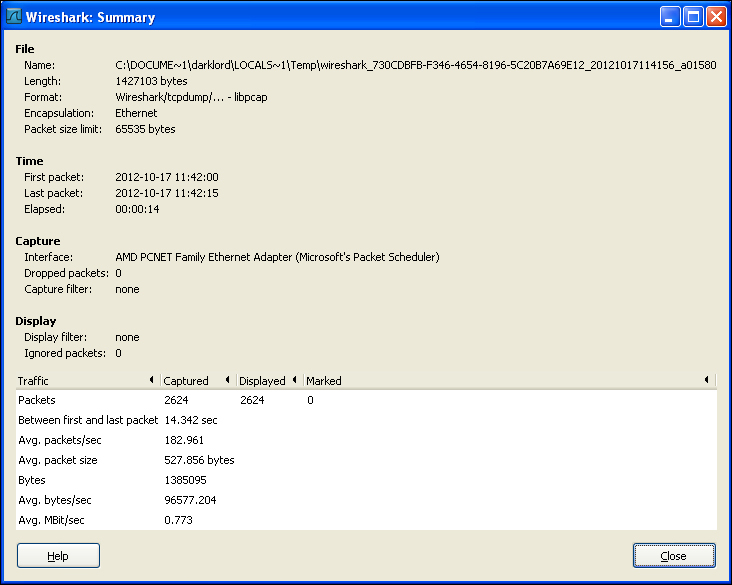
Summary
Summary returns a quick report about the entire capture process by reflecting key points such as interface, capture duration, and number and size of packets captured. It provides all the information in a nutshell. Summary is very useful during network forensics when a quick overview of network activity is required.
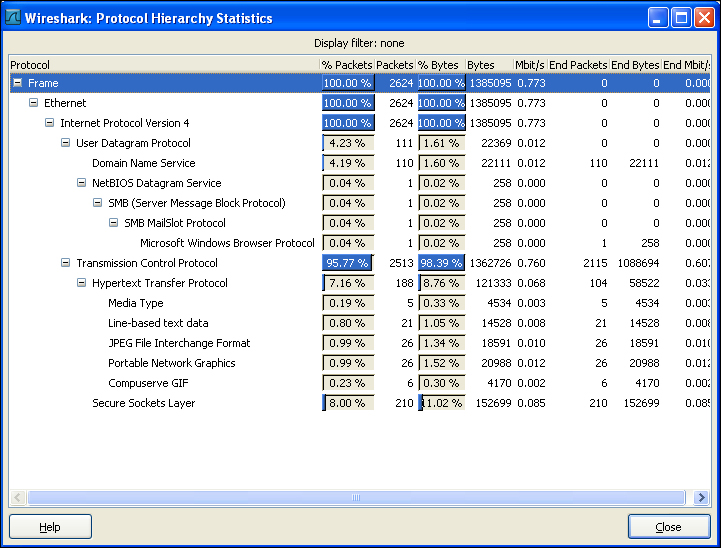
Protocol Hierarchy
Protocol Hierarchy reflects the statistical information of different protocols seen during network analysis in a nodal form. It arranges the protocols according to its layers and represents their existence in the captured file in percentage form.
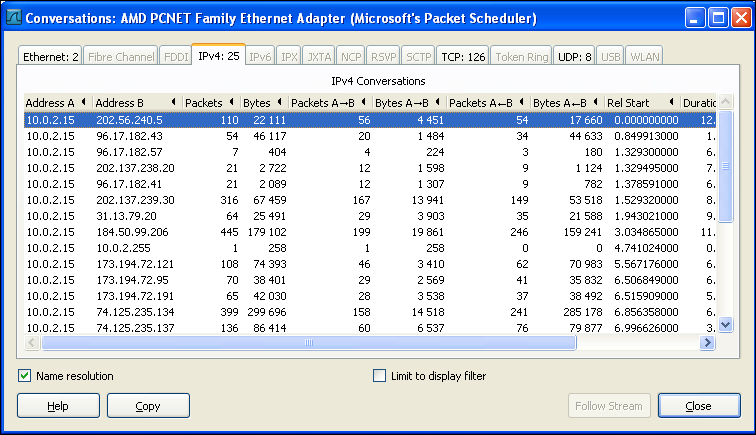
Conversations
Conversation is another very interesting statistical analysis of data packets which shows information about communication between different IPs. It also shows Conversation statistics of different protocols transferred over an IP. This is the best statistical analysis when an end-to-end analysis has to be carried out between the host and server.
Endpoints
Endpoint statistics is similar to Conversations as it reflects the statistics of traffic to and from an IP address.
Flow graph
Flow graphs are a timeline-based representation of communication statistics. They represent the different conversations carried out based on time intervals. Clicking on Flow Graph launches a dialog box which asks for some initial information before generating the graph.
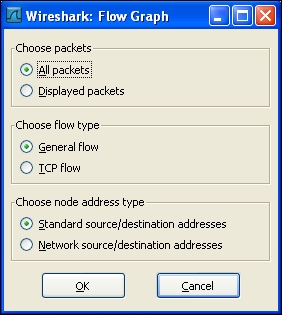
We can specify information such as choosing packets, flow type, and the mode in which the graph will reflect information. This statistical analysis is helpful in reading the timeline of network activity. It also helps in understanding the traffic load over time duration.
This was a basic demonstration of using different statistical options provided by Wireshark in order to have a better understating of our network capture. In the next section we will cover some technical aspects involved in Wireshark’s reassembling and name resolution techniques.
4)Name resolution and packet reassembling
Some more important Wireshark features that make our network analysis process easier and more informative are as follows:
Name resolution
Name resolution is the process of converting one identifying address into another for better understanding. For example, if a computer has a physical address of 00:16:CD:6C:8B:24, the DNS and ARP protocols allow us to view the readable name as MYPC-01. This association makes it easy to remember different devices on a network. Wireshark provides several name resolution tools that can convert physical addresses into corresponding readable device names. Let us take a quick look at some of the resolution tools present in Wireshark.
MAC name resolution
MAC name resolution uses the ARP/RARP protocol to convert a physical address (MAC) into its corresponding logical address (IP).
Network name resolution
Network name resolution further converts the logical address(IP) into its corresponding DNS name for better understanding. For example, 173.194.72.101 becomes google.com.
Transport name resolution
This name resolution technique identifies the service according to its port number. For example, port 80 hosts http service.To enable name resolution in Wireshark, select Capture | Capture Options. This will launch the capture options dialog box which we have also seen earlier. The bottom-right side of this dialog box shows the Name Resolution checkbox for different categories.
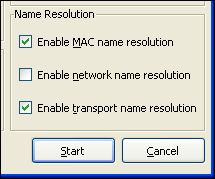
You can select the different checkboxes based on your needs. Alternatively, you can also launch the Name Resolution dialog box by selecting Edit | Preferences | Name Resolution.
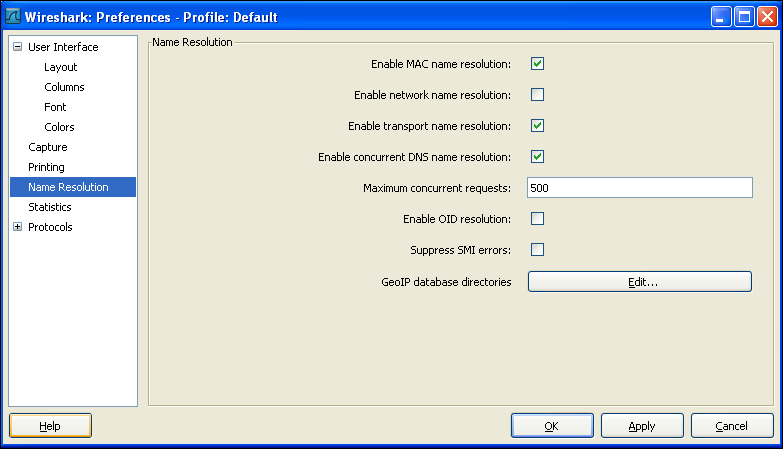
This provides even more advanced options as compared to the previous one. Here we can also provide a GeoIP database to Wireshark that can further improve the resolution power of Wireshark by helping it in identifying the packet regions based on its GeoIP.
This feature of Wireshark not only makes network analysis easier but also increases the capability of Wireshark in recognizing different protocols and services. But name resolution also has some drawbacks that need to be mentioned here.
- Name resolution may fail during live capture or while opening a saved capture file
- Name resolution adds extra bytes of spaces into the packet file thus affecting the statistical graphs
- Name resolution adds additional overheads at packet processing
Now let us move to the next important discussion of this section.
Packet reassembling
Packet reassembling is the process of transferring large chunks of data by splitting it into smaller packets and later on combining them again to form the complete data. In order to efficiently reproduce the captured data, Wireshark also implements its own packet reassembling technique.Wireshark collects the different chunks of packets of the fragmented data and then reassembles it to reflect the complete file through the packet bytes panel.
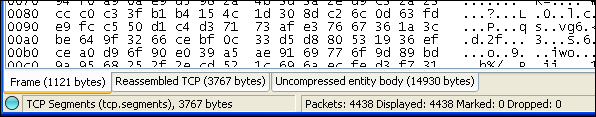
For example, an HTTP GET request (HTML page) can be broken into smaller data packets. Once the transmission is complete, Wireshark reassembles the different packets and creates a single reassembled HTML page. The packet details panel adds extra information (Reassembled TCP segments) about the different packet numbers that are reassembled to form the complete set of data.
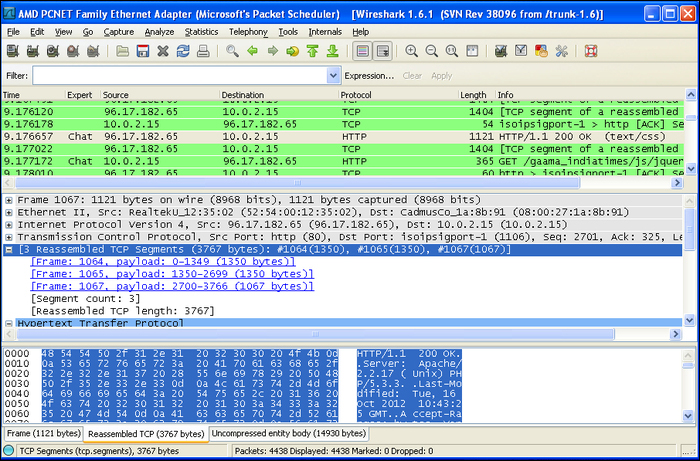
The complete reassembled data is reflected under the Uncompressed entity body tab of the packet bytes panel and its Hex dump is reflected under the Reassembled TCP tab.
—
Major Features Of Wireshark
Wireshark has a rich feature set which includes the following:
- Deep inspection of hundreds of protocols, with more being added all the time
- Live capture and offline analysis
- Standard three-pane packet browser
- Multi-platform: Runs on Windows, Linux, macOS, Solaris, FreeBSD, NetBSD, and many others
- Captured network data can be browsed via a GUI, or via the TTY-mode TShark utility
- The most powerful display filters in the industry
- Rich VoIP analysis
- Read/write many different capture file formats: tcpdump (libpcap), Pcap NG, Catapult DCT2000, Cisco Secure IDS iplog, Microsoft Network Monitor, Network General Sniffer® (compressed and uncompressed), Sniffer® Pro, and NetXray®, Network Instruments Observer, NetScreen snoop, Novell LANalyzer, RADCOM WAN/LAN Analyzer, Shomiti/Finisar Surveyor, Tektronix K12xx, Visual Networks Visual UpTime, WildPackets EtherPeek/TokenPeek/AiroPeek, and many others
- Capture files compressed with gzip can be decompressed on the fly
- Live data can be read from Ethernet, IEEE 802.11, PPP/HDLC, ATM, Bluetooth, USB, Token Ring, Frame Relay, FDDI, and others (depending on your platform)
- Decryption support for many protocols, including IPsec, ISAKMP, Kerberos, SNMPv3, SSL/TLS, WEP, and WPA/WPA2
- Coloring rules can be applied to the packet list for quick, intuitive analysis
- Output can be exported to XML, PostScript®, CSV, or plain text
AWS
Installation Instructions For Windows
Note: How to find PublicDNS in AWS
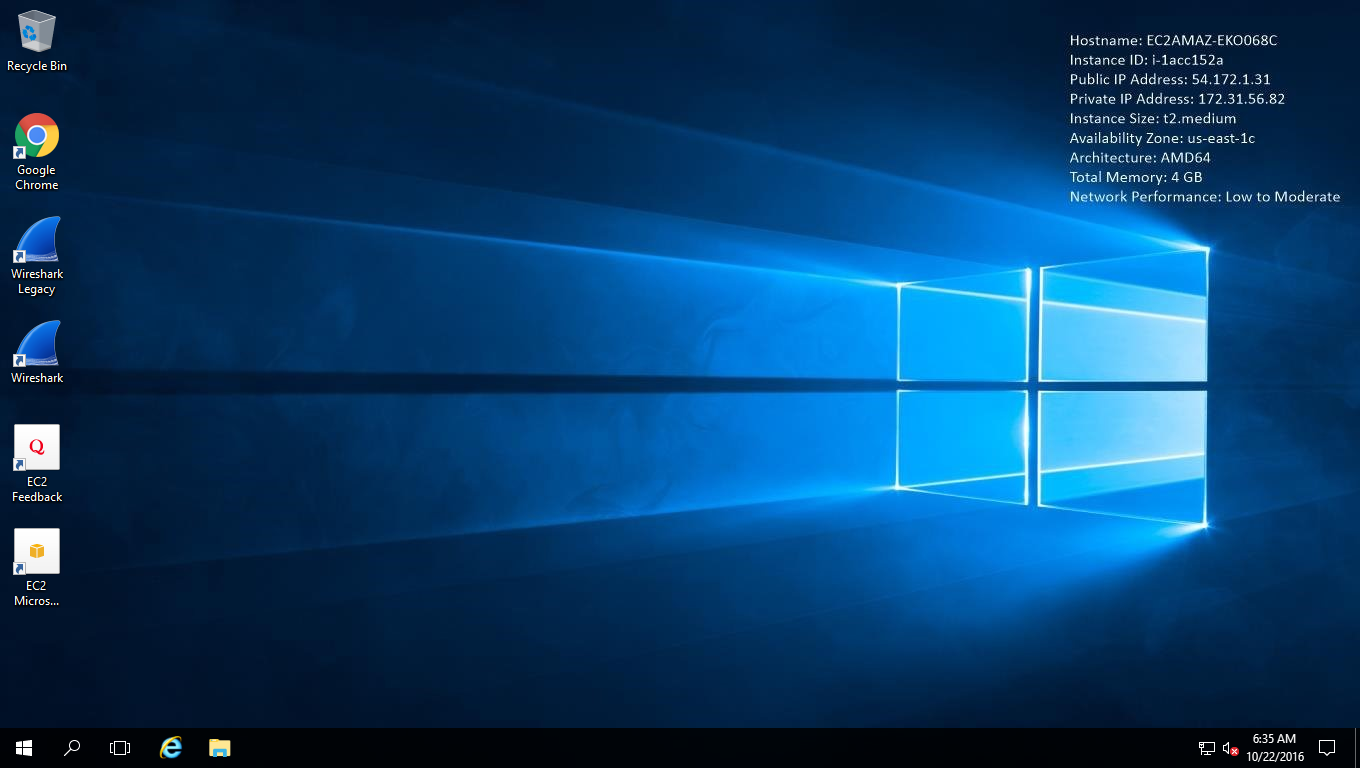
Step 1) RDP Connection: To connect to the deployed instance, Please follow Instructions to Connect to Windows instance on AWS Cloud
1) Connect to the virtual machine using following RDP credentials:
- Hostname: PublicDNS / IP of machine
- Port : 3389
Username: To connect to the operating system, use RDP and the username is Administrator.
Password: Please Click here to know how to get password .
Step 2) Click the Windows “Start” button and select “All Programs” and then point to Wireshark
Step 3) Other Information:
1.Default installation path: will be in your root folder “C:\Program Files\Wireshark “
2.Default ports:
- Windows Machines: RDP Port – 3389
- Http: 80
- Https: 443
Configure custom inbound and outbound rules using this link
Installation Step by Step Screenshots
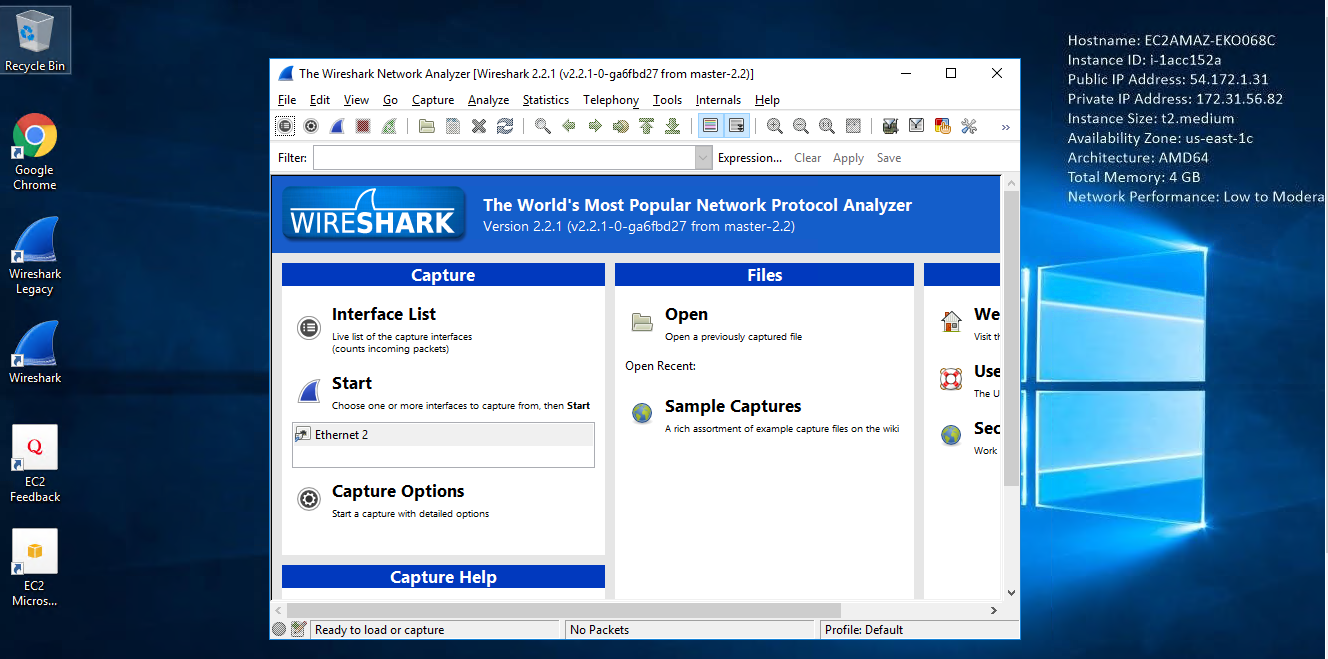
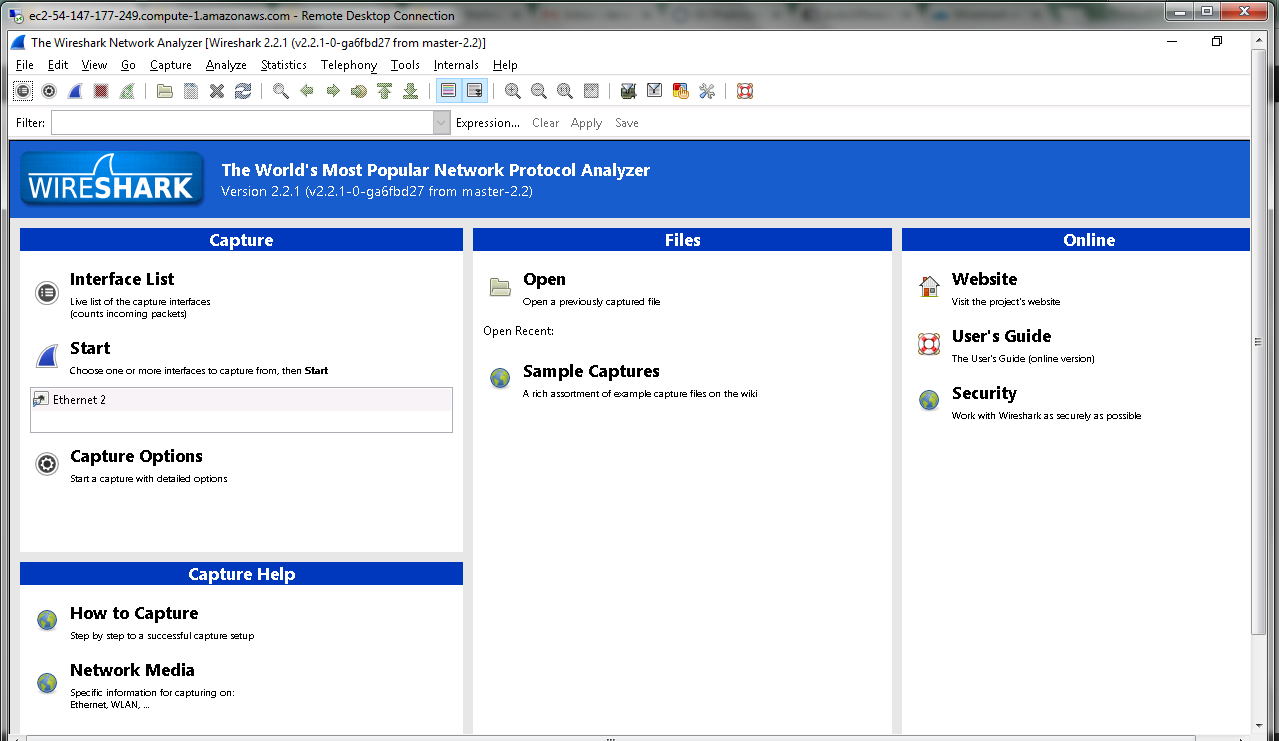
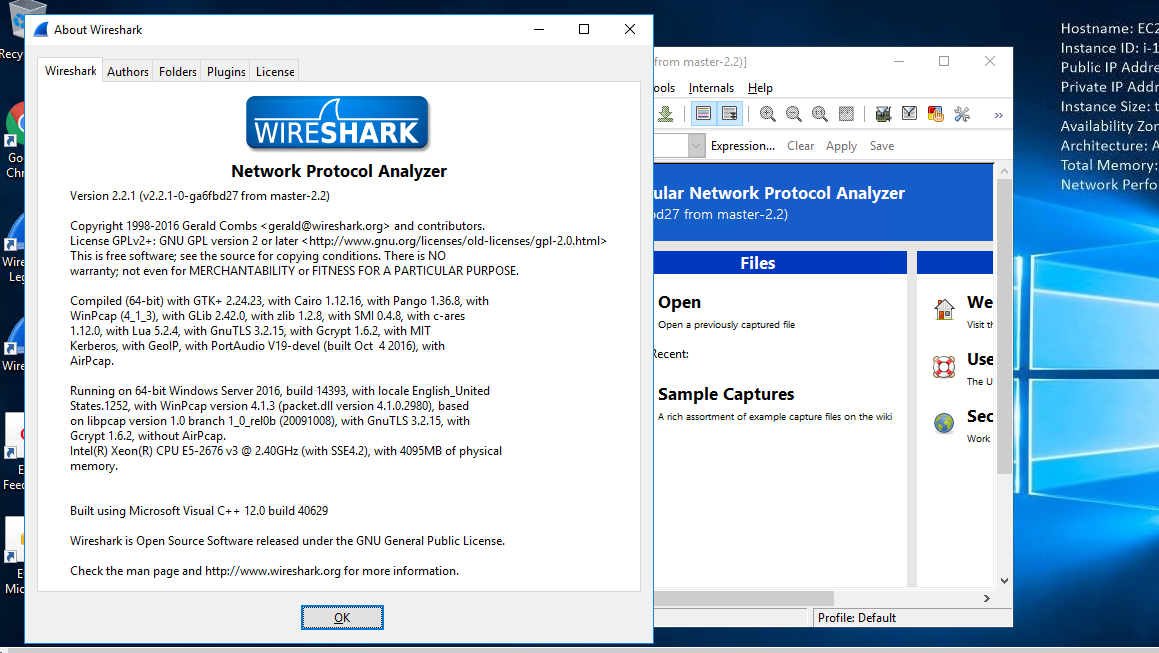
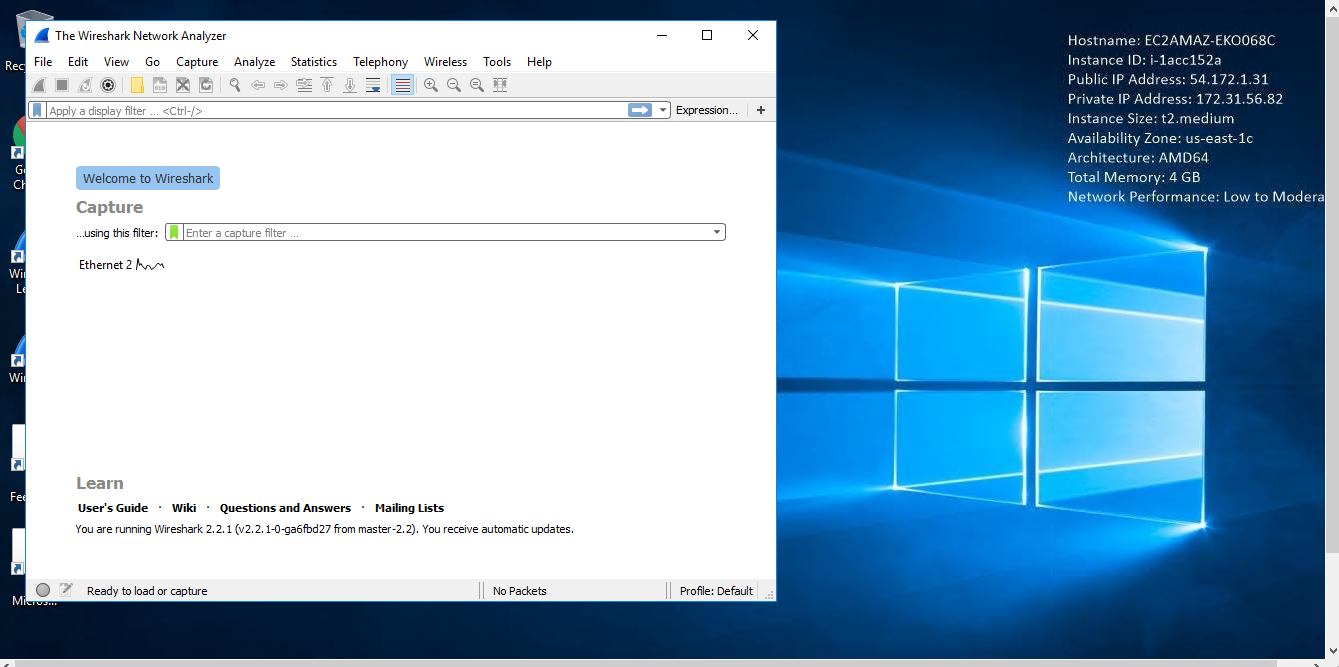
Installation Instructions For Windows
Installation Instructions for Windows
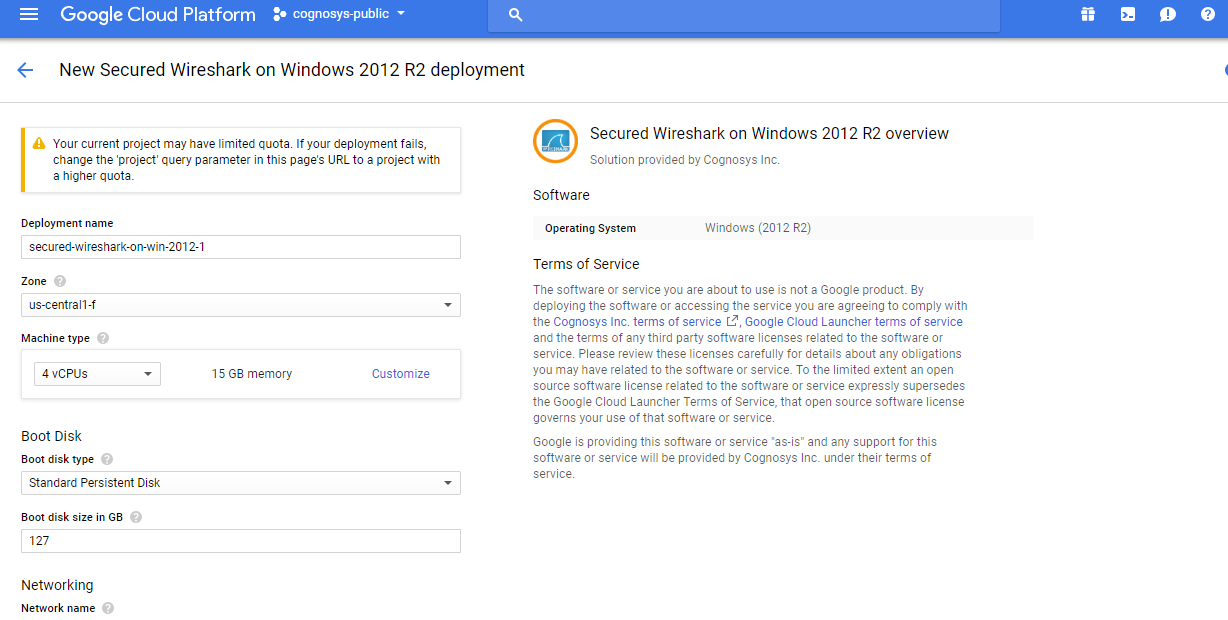
Step 1) VM Creation:
- Click the Launch on Compute Engine button to choose the hardware and network settings.
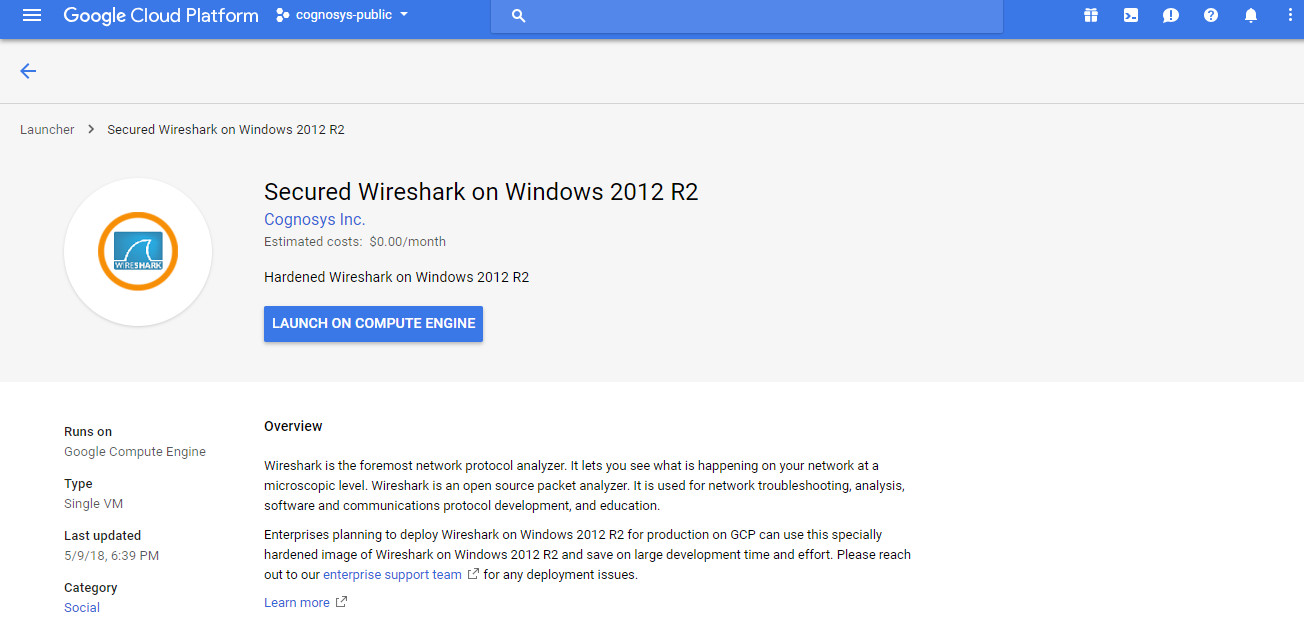

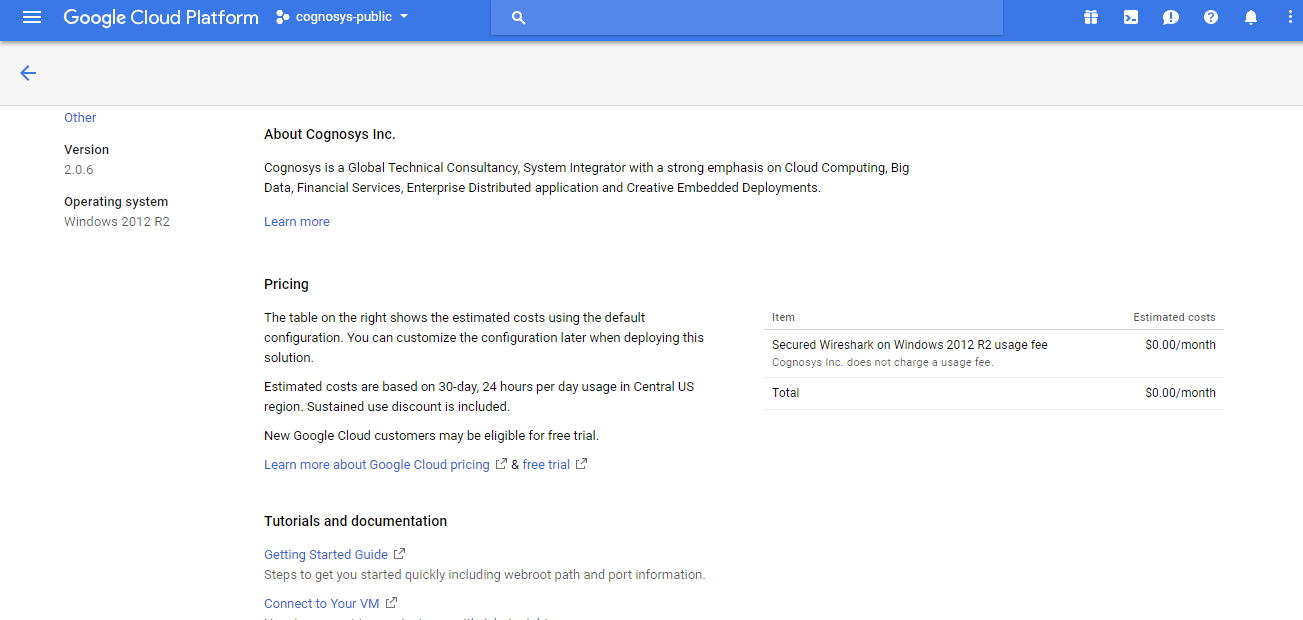
- You can see at this page, an overview of Cognosys Image as well as estimated cost of running the instance.

- In the settings page, you can choose the number of CPUs and amount of RAM, the disk size and type etc.

Step 2) RDP Connection: To initialize the DB Server connect to the deployed instance, Please follow Instructions to Connect to Windows instance on Google Cloud
Step 3) Click the Windows “Start” button and select “All Programs” and then point to Wireshark
Step 4) Other Information:
1.Default installation path: will be in your root folder “C:\Program Files\Wireshark “
2.Default ports:
- Windows Machines: RDP Port – 3389
- Http: 80
- Https: 443