1-click AWS Deployment 1-click Azure Deployment
Overview
Performance Analysis of Logs (PAL) tool is a powerful tool that reads in a performance monitor counter log (any known format) and analyzes it using known thresholds. Basically, it automates the analysis of performance counter logs, for instance, one th The at is generated by the Benchmark Wizard. At the end, you can generate an HTML or XML-based report that graphically charts important performance counters and throws alerts (in red), when thresholds are exceeded. The thresholds are originally based on thresholds defined by the Microsoft product teams, including the BizTalk Server, and members of Microsoft support.
Before PAL, it was quite hard to analyze logs, which had to be done manually and required quite extensive knowledge of the Windows Architecture. It could also require a lot time to analyze the logs and so investment in money. There are tools that could help in the analysis such as the Microsoft System Center Operation Manager, but might not collect critical data that is necessary or the Microsoft Server 2008 Performance toolkit, which is limited for Windows 2003. There was not really a tool that could analyze log file(s) easy and fast. PAL does just that, it analyzes logs and does not require much time, and is free.
This tool has the following benefits:
- Analyzes performance counter logs for thresholds
- Is helpful for large Perfmon logs
- Identifies BizTalk Server and operating system performance counter bottlenecks by analyzing for thresholds
- Is extensible to do analysis on any performance counters
- Can be used to help write your own counter.
How to download :
Perequisites:
Log Parser
the .NET Framework
the Office 2003 web components
Then run it and use its wizard-like interface to select the counter file you want to process and, if you’re on Exchange 2007, the server role that generated it. Depending on the role you choose, you might need to answer questions about the selected server, such as the number of processors or the amount of RAM. After you’ve done so, PAL processes the logs and renders HTML reports that highlight the most notable performance data from the server. You can use PAL to get a quick overview of how an Exchange Server is performing, then drill down to get more detail on specific counter sets that give information about a specific subsystem or component.”
If you wish to install the PAL tool, then download PAL_Setup. It contains the Microsoft installer files. Right-click and go to Properties of the zip file, select Unblock, and then click OK. Extract the zip file to a new, empty folder, and then run Setup.
If you just want to run it without installation, then download PAL_FlatFile. Right-click and go to Properties of the zip file, select Unblock, and then click OK. Extract the zip file to a new, empty folder, and then run PALWizard.exe to use the tool.
Performance Analysis of Logs is a powerful and reliable application which enables you to open, read and analyze performance monitor counter logs regardless of their format. The program uses a series of known thresholds to perform the log analysis. The application includes thresholds from the majority of popular Microsoft utilities, such as MOSS, IIS, BizTalk, SQL Server, Active Directory, and MS Exchange.
Performance Analysis of Logs comes with a simple and friendly interface which allows you to easily create batch files. The threshold files can be edited according to your wishes, as well. Furthermore, the porgram lets you create your own threshold files.
Performance Analysis of Logs will generate an HTML based report which can be easily copied and pasted into other applications.
Pros
- The application comes with a clean and friendly interface.
- The program generates HTML based reports which can be imported into other applications.
The PAL (Performance Analysis of Logs) tool is a powerful tool that reads in a performance monitor counter log and analyzes it using known thresholds.
The PAL tool is primarily a PowerShell script that requires arguments/parameters passed to it in order to properly analyze performance monitor logs.
If you’ve ever has a performance problem but had no idea what metrices to collect or even how to analyse the compiled data, PAL is your friend. This open source tool helps read performance monitor counter logs and analysis them for you, using built-in thresholds that relate to the majority of your Windows products, including Exchange , Sharepoint, Active Directory, and more.
Performance Analysis of Logs (PAL) Tool on Cloud for AWS

Features
Major Features Of PAL:
- Thresholds files for most of the major Microsoft products such as IIS, MOSS, SQL Server, BizTalk, Exchange, and Active Directory.
- An easy to use GUI interface which makes creating batch files for the PAL.ps1 script.
- A GUI editor for creating or editing your own threshold files.
- Creates an HTML based report for ease of copy/pasting into other applications.
- Analyzes performance counter logs for thresholds using thresholds that change their criteria based on the computer’s role or hardware specs.
AWS
Installation Instructions For Windows
Note: How to find PublicDNS in AWS
Step 1) RDP Connection: To connect to the deployed instance, Please follow Instructions to Connect to Windows instance on AWS Cloud
1) Connect to the virtual machine using following RDP credentials:
- Hostname: PublicDNS / IP of machine
- Port : 3389
Username: To connect to the operating system, use RDP and the username is Administrator.
Password: Please Click here to know how to get password .
Step 2) Click the Windows “Start” button and select “All Programs” and then point to Performance Analysis of Logs(PAL).
Step 3) Other Information:
1.Default installation path: will be in your root folder “C:\PAL_Flatfiles_v2.7.6_x64“
2.Default ports:
- Windows Machines: RDP Port – 3389
- Http: 80
- Https: 443
Configure custom inbound and outbound rules using this link
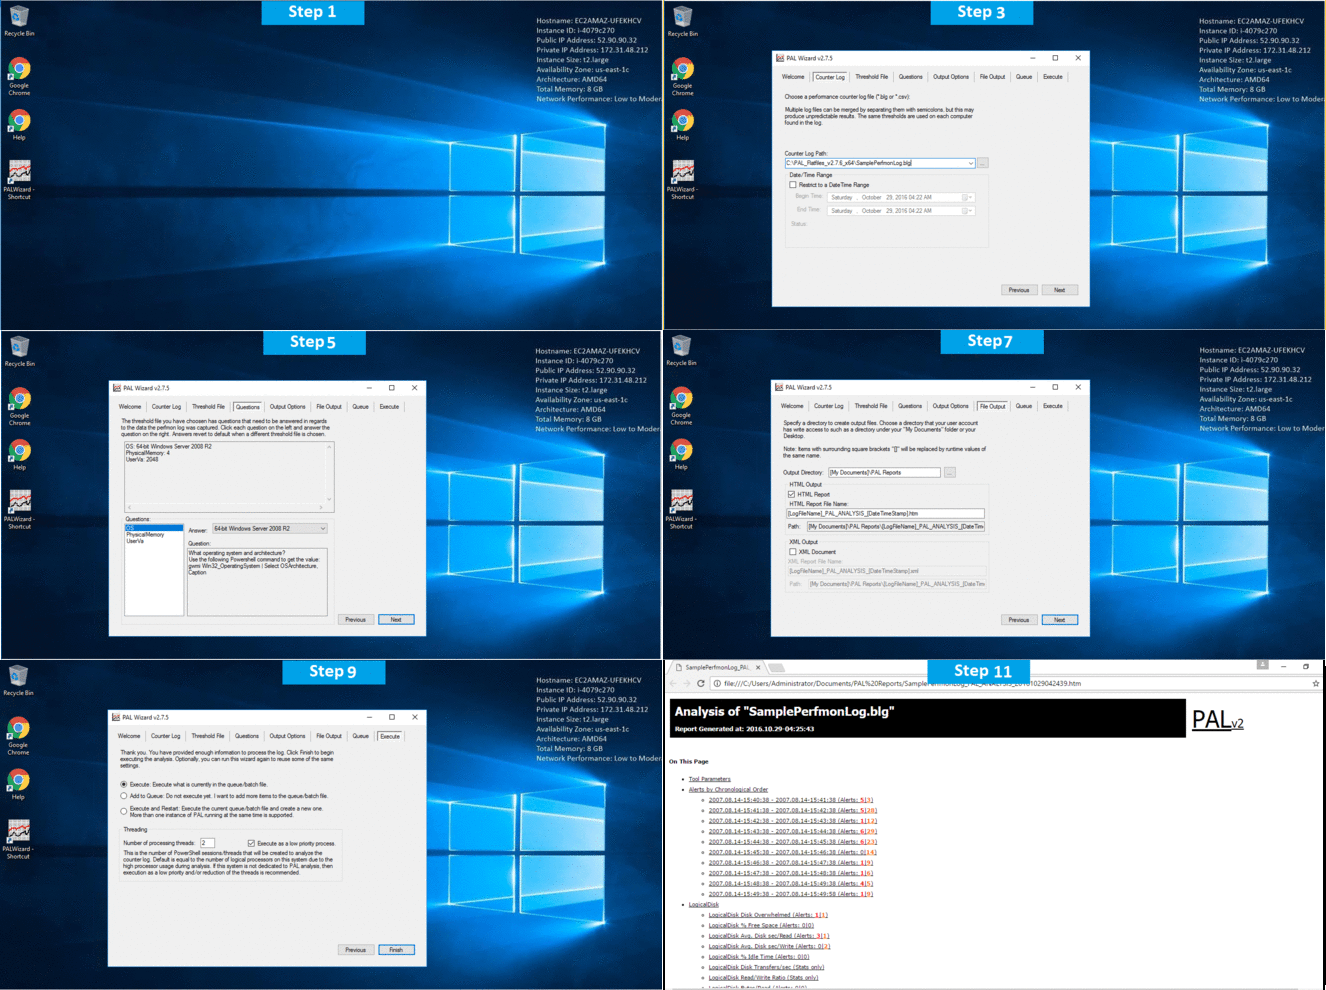
Installation Step by Step Screenshots
Videos


