1-click AWS Deployment 1-click Azure Deployment
Overview
Node.js is an open-source, cross-platform runtime environment for developing server-side Web applications. Although Node.js is not a JavaScript framework,many of its basic modules are written in JavaScript and developers can write new modules in JavaScript. The runtime environment interprets JavaScript using Google’s V8 JavaScript engine.
Node.js has an event-driven architecture capable of asynchronous I/O. These design choices aim to optimize throughput and scalability in Web applications with many input/output operations, as well as for real-time Web applications (e.g., real-time communication programs and browser games).
Node.js is an open source Javascript runtime environment for easily building server-side and networking applications. The platform runs on Linux, OS X, FreeBSD and Windows and its applications are written in JavaScript. Node.js applications can be run at the command line but we will teach you how to run them as a service, so they will automatically restart on reboot or failure, so you can use them in a production environment.
Node.js on cloud
- js tools to build cloud-native apps, deploy at scale, and analyze data. check Build planet-scale web apps. check Use Google’s machine learning APIs with native library support. check Write serverless apps with ease. check Create Big Data analysis applications without learning another language.
Node.js tools to build cloud-native apps, deploy at scale, and analyze data
Build planet-scale web apps
Use Google’s machine learning APIs with native library support
Write server-less apps with ease
Create big data analysis apps without learning another language
Generate Node.js cloud native projects.
The Challenge
According to the, key technologies to implement and run cloud native applications include:
- Docker
- Kubernetes
- Helm
- Prometheus
Moreover, cloud native applications are commonly built using ae, which is a distributed application architecture, comprised of multiple, separately running services. Building these apps require additional artifacts, such as:
- Docker files
- Kube config
- Helm charts
- Kubernetes liveness probes
- End-to-end trace points
- Prometheus instrumentation
The combination of cloud native technologies and microservice architecture creates a lot for a developer to think about before even getting down to writing code.
Help is Here
To make things easier, we have worked a lot of this out for developers through a new Yeoman generator named . The nodeserver generator creates fully functional Express-based Node.js application projects that include:
- Docker files for release and development containers.
- Helm charts with substitution values for deployment to any Kubernetes environment.
- Monitoring endpoints:
- Kubernetes liveness probes.
- Zipkin for end-to-end request tracing to spot bottlenecks.
- Prometheus for visualizing performance problems across app components.
- App Metrics with flame graphs for drill down into individual Node.js processes.
Additionally, these projects can include optional scaffolding for access to IBM Cloud Services, such as Data, Finance, and Watson.
Install and use are easy:
- install: npm install -g yo generator-nodeserver
- run: ‘yo nodeserver’ to create cloud native projects.
You can build/deploy these projects using standard tools like npm, docker and helm, or you can use ) to simplify these tasks. Note the projects created by the nodeserver generator include npm scripts to help you install and use IDT, just look for the idt:* scripts in your package.json file.
Watch the videos on to get a better idea of what IDT can do for you.
The bottom line is the nodeserver Yeoman generator does a great job creating cloud native projects, complete with all the essential ingredients, and IDT is a great companion tool to simplify building, testing, and deploying your dockerized apps. Together they make it a cinch to build and deploy cloud native apps to any Kubernetes environment, especially the IBM Cloud.
Microservice Builder for Node.js deployments
Microservice Builder makes the deployment stage much easier once set up for those who aren’t yet Kubernetes wizards by providing a pipeline that enables developers to quickly become productive: focusing on writing great application code rather than setting up “DevOps” pipelines for Kubernetes themselves.
In this blog post I’ll be covering how to do exactly that for Node.js deployments specifically, although this should work with any containerized application as well.
Note that as of March 2018, you should instead be using which has superseded Microservice Builder. After deploying Microclimate, you’ll want to either create a new Node.js project using the UI we provide (as part of the “portal”), or import your existing project. The pipeline will be set up (as demonstrated below) and you’ll still need a Jenkinsfile.
We’ve made it easy at IBM to use Microservice Builder when deploying to, but you can take advantage of this tutorial whether you’re deploying to IBM Cloud Private or another Kubernetes target.
You’ll have the following in place by the end of this guide:
- A Jenkins pipeline that will build and deploy your application to the Kubernetes cluster it’s running on:

- Working Node.js code that satisfies the criteria to be deployed using Microservice Builder – has a Jenkinsfile with content such as:
#!groovy@Library(‘MicroserviceBuilder’) _microserviceBuilderPipeline { image = ‘ibm-nodejs-sample’ CHART_FOLDER=”chart”}
- A Git repository that’s being watched for changes by Microservice Builder:
 The pipeline in action
This covers committing to a watched Git repository, triggering the Jenkins pipeline, and the change making its way into our cluster as a Node.js application deployment.
What we’ll need
- A Linux or macOS environment is recommended.
- A browser – we’ll be using Google Chrome.
- (details below).
- A Kubernetes cluster (e.g. IBM Cloud Private). Minikube should also work too,For IBM Cloud Private, head to the and proceed until you’ve got a cluster set up on your machine(s) – you’ll only need one node and you can follow the . You’ll know you’re ready when you see the following:
 Familiarity with Git is recommended.
- Code to deploy! You’ll want a Dockerfile, a Helm chart or an application definition Kubernetes can understand, and a listen server.
- If you don’t want to use IBM Cloud Private, you should be able to use all of the features here on Bluemix or a local Minikube deploymenTL;DR version?
- Push a containerized app’s code up to a Git repository that’s in a Git organization that Microservice Builder will watch – you’ll need a Jenkinsfile in this repository.
- Install Microservice Builder into your Kubernetes cluster using the app center.
- Access the pipeline at port 31000, click “Scan organization now”, “Scan repository now”, and watch as the pipeline kicks off and is all green.
- It’s built and deployed: visit your application’s frontend in the web browser on the Kubernetes cluster.
- Every subsequent Git commit to a configurable deployment branch will be automatically used to build and deploy your app to the cluster.
Why Microservice Builder?
- Provides a Jenkins/Docker/Git/Kubernetes based pipeline for continuous delivery.
- Developers can focus on writing microservices as opposed to learning Kubernetes intricacies: write more Node.js code.
- Lowers the bar of entry for developers to deploy using Kubernetes.
Grabbing some code
We can obtain sample code to deploy in a number of straightforward ways and the critical files for a project to be deployable with Microservice Builder are as follows:
- Jenkinsfile: for the Microservice Builder pipeline to work (also where configurations can be made).
- Dockerfile: our application needs to be a “containerized” one.
- The Helm chart (yaml, values.yaml, templates/deployment.yaml and templates/service.yaml).
Example 1: use an existing project
You can use the: clone it to your laptop or don’t do anything for now as we can fork it into a configured Git organization later.
Example 2: yo nodeserver
Yeoman generator (entirely Node.js). Best used in combination with straight Helm and kubectl.
npm install -g generator-nodeserveryo nodeserver
Example 3: bx dev (“idt”) create
Written in Go and not guaranteed to work on all platforms that Node.js does. More advanced and covers more use cases, such as deploying.
export DESIRED_VERSION=v2.4.1
curl | bash
You’ll want to set the DESIRED_VERSION (for Helm) to match the version of Helm running on the server. As with yo nodeserver there are prompts for us to follow so we can create a Node.js application.
Setting up the org and repository for Microservice Builder to watch
Follow the instructions for until you have the following:
- A OAuth Application token, mine’s a secret.
- A Github Application ID (aka a “Client ID”), mine is 1d21508da85ce1ded76d.
- A Github Application secret (aka a “Client Secret”), mine’s a secret.
- A Github org, mine is called adam-msb-blog-tester.
- A Github repository with our code to deploy, mine is called watch-this-repo.
I recommend adding the contents into a text file you’ll also be keeping safe as we’ll be providing these values as parameters for the next important step.
Pushing your code up to a repository
The easiest thing to do here is to fork the sample I mentioned into your organization.
Or set up a repository locally, put your yo nodeserver or idt create provided code in here and then push it up to your repository and organization.
In the folder where your code is, you’d need to initialize the repository, add the remote, then commit and push your code up, for example (and this is exactly as we’re given when creating a Git repository using the web UI):
git initgit commit -m “first commit”git remote add origin git push -u origin master
You can go ahead and fork or push your code up to the repository that’s in the organization that Microservice Builder is watching.
Installing the Microservice Builder pipeline
With your Git repository and org set up, we’ll configure the Microservice Builder pipeline next.
It’s a lot quicker to set up than the Git org and repository – Microservice Builder is available in the app center for IBM Cloud Private.
Access the catalog:
Then search for “microservice” and you’ll see the following two installs are available:
It’s the “ibm-microservicebuilder-pipeline” chart we’ll be using in this tutorial and we’ll be needing the details from the Github application we’ve created.
Click anywhere on the tile to be taken to the documentation for the Helm chart.
At the bottom right you’ll see a big blue “Configure” button – so click that and we can proceed to fill in the details using our Github information.
There’s lots we can configure but we should only care about the following values for now. These are all under the first section titled “Github”:
- URL: or your GHE URL
- RepoPattern: repositories with a name matching this pattern will be checked, built and deployed by Microservice Builder. Change this to “.*” (that’s “dot asterisk”) to build anything pushed up to a repository in the organization.
- Orgs: the name of the organization to watch.
- OAuth.User: the name of the user that we created an OAuth token for.
- OAuth.Token: this is the personal access token you definitely made a copy of earlier! From the application details we recorded earlier.
- App.Id: also known as the client ID. From the application details we recorded earlier.
- App.Secret: also known as the client secret. From the application details we recorded earlier.
- Admins: this can be the same value as the OAuth.User.
In this example the values are as follows.
Make sure you fill in the app secret and the OAuth token values as well.
Click “Install” and you should get a success prompt – if all went well we’re ready to access the pipeline that’s been configured to watch our repository!
We can then visit the pipeline in our web browser. It’ll be at the master or proxy URL and, by default, port 31000 in this example, where 172.16.216.75/console is where I can view the IBM Cloud Private dashboard).
We’ll need to authorize the application when prompted, and then we’ll see the main Jenkins page once it’s started up.
Here’s the organization that’s picked up with Microservice Builder:
This is how an empty repository without a Jenkinsfile would look:
Not so fast – we need to enable our Microservice Builder pipeline to pull from the private registry next.
This is also covered at the and involves adding the admin.registrykey secret.
By using the pipeline you’ll be pushing your application as a Docker image to the IBM Cloud Private Docker registry – the secret is used to authenticate with it so that problems don’t occur when pulling the image to be run on pods.Back to building and deploying.
You know you’re ready to go when there are no problems with the Jenkins slave pods when you do:
kubectl get pods
Our first build and deploy!
From the Jenkins interface, we want to scan the organization now and our repository will be picked up.
If you’re having trouble at this stage, configure the job and take a look at the “repository pattern” that this job will be watching.
If you’ve followed the above steps correctly, you’ll see your application has been built and deployed successfully!
Green for successful stages, Red for ones that failed – and you can cancel the pipeline at any time as I did the first time around.
Viewing your deployment
At the end of the console log for the build (in this case #2), we can see:
Release “ibm-nodejs-sample” does not exist. Installing it now.NAME: ibm-nodejs-sampleLAST DEPLOYED: Thu Oct 26 18:42:44 2017NAMESPACE: defaultSTATUS: DEPLOYEDRESOURCES:==> v1beta1/DeploymentNAME DESIRED CURRENT UP-TO-DATE AVAILABLE AGEibm-nodejs-sample-ibm-no 1 1 1 0 2s==> v1/ServiceNAME CLUSTER-IP EXTERNAL-IP PORT(S) AGEibm-nodejs-sample-ibm-no 10.0.0.237 <nodes> 3000:30952/TCP 2sNOTES:The Node.js sample can be viewed in the web browser.export SAMPLE_NODE_PORT=$(kubectl get –namespace default -o jsonpath=”{.spec.ports[0].nodePort}” services ibm-nodejs-sample-ibm-no)export SAMPLE_NODE_IP=$(kubectl get nodes –namespace default -o jsonpath=”{.items[0].status.addresses[0].address}”)echo “Open your web browser at
These are the notes for the sample itself (provided in the Helm chart). Any Helm install will have the “RESOURCES:” information for you to use.
Accessing your deployment
- With IBM Cloud Private you can use the menu to navigate for “Workloads” then “Services“, find the service for what you’ve just deployed and then click on the HTTP endpoint button.
- You can also determine the endpoint from an optional notes.txt file in the Helm chart (like with the IBM Cloud Private Node.js sample).
- You can also determine the endpoint from the output of the “helm upgrade” command in the Jenkins job. The IP address and NodePort values are what you’ll need.
How to continue using Microservice Builder once it’s set up?
- Nobody needs to do the above again! It’s all configured for developers to use.
- Subsequent commits will be built and deployed for you. You can as well so the application’s automatically deployed.
- Developers push code up to to the repository that’s being watched: by default what’s pushed to “master” will be deployed (this is configurable in the pipeline).
- Developers can kick off a manual build/deploy by navigating to the Jenkins instance in their browser.
Conclusion
- This example makes use of the fact that looks for a Dockerfile and will build and deploy that.
- The presence of the Jenkinsfile allows the Jenkins job to recognise this as being something that can be built and deployed.
- Getting set up is a pain – many steps for a user to follow. Once set up, it’s easy for developers to use – making code changes, pushing it up, having the changeset be deployed.
- You can customise the pipeline by setting up deployment branches and modifying the pipeline itself – you can change the pipeline definition and kill the pod for it to return with the changes taking effect.
https://developer.ibm.com/node/2017/10/27/microservice-builder-node-js-deployments/
Monitoring & Diagnostics – Scenarios
The approach you take to diagnose the problem depends on the scenario, but also on the requirements of the production deployment. The priority is to maintain the availability of the application, which usually involves fail-over to a separate application instance or restart of the failing application.
Techniques used during development, such as attaching a debugger or adding instrumentation to the application, are not usually available in production deployments. The use of tracing or monitoring tools that are not invasive and have minimal impact on the running application might be possible, but the capture of diagnostic information such as logs and dumps at the point of failure is often the most practical approach.
Uncaught exceptions or error events in JavaScript code
Uncaught exceptions or error events in JavaScript code usually result in termination of the Node.js application, with an error message and stack trace written to the console: that is, to the stdout or stderr stream.
For example, the following output is written if a Node.js application cannot find a JavaScript module that it is required to load:
Cannot find module ‘C:\test\unknown’ at Function.Module._resolveFilename (module.js:469:15) at Function.Module._load (module.js:417:25) at Module.runMain (module.js:604:10) at run (bootstrap_node.js:394:7) at startup (bootstrap_node.js:149:9) at bootstrap_node.js:509:3
Tooling suggestions:
- Use the npm native module. Output includes JavaScript and native stack traces, heap statistics, platform information, and resource usage. See (on YouTube), Node.js stack traces are limited to the code stack that is running for the current event. To trace the full code path use one of the following applications:
- (long stack traces for node.js over async/io boundaries)
- (super-long stack traces)
Excessive memory usage (memory leak), which might result in an out-of-memory (OOM) error
Excessive memory usage by a Node.js application is often detected by scripts that use operating system facilities, or by production monitoring tools. Sometimes the application fails as it reaches a limit configured in Node.js or in the operating system, producing error output, such as the following example:
<— Last few GCs —> 7299 ms: Mark-sweep 33.0 (64.2) -> 33.0 (64.2) MB, 72.2 / 0.0 ms (+ 14.6 ms in 13 steps since start of marking, biggest ms) [allocation failure] [GC in old space requested]. 7391 ms: Mark-sweep 33.0 (64.2) -> 33.0 (64.2) MB, 92.8 / 0.0 ms [allocation failure] [GC in old space requested]. 7485 ms: Mark-sweep 33.0 (64.2) -> 33.0 (46.2) MB, 93.5 / 0.0 ms [last resort gc]. 7580 ms: Mark-sweep 33.0 (46.2) -> 33.0 (46.2) MB, 95.4 / 0.0 ms [last resort gc]. <— JS stacktrace —> Security context: 0000037D843CFB61 <JS Object> 2: my_listener [C:\test\heap_oom.js:~9] [pc=00000255FA5B3A8D] (this=000001240487E6E9 <a Server with map 000002302D633F89>,request=000001240487E5F9 <an IncomingMessage with map 000002302D636EF9>,response=000001240487E581 <a ServerResponse with map 00000F79>) 3: emitTwo(aka emitTwo) [events.js:106] [pc=00000255FA522153] (this=0000037D84304381 <undefined>,handler=000003F40AEE39F FATAL ERROR: CALL_AND_RETRY_LAST Allocation failed – JavaScript heap out of memory
In the case of excessive memory usage, the error output is not usually sufficient for you to diagnose the problem, as it cannot provide details of the complex memory use by the application. You must take additional steps to capture more information, and use appropriate tooling to analyse it.
Tooling suggestions:
- Use heapdump to capture a JSON-format heap dump, which you can analyse by using the Dev Tools in the Google Chrome browser. For more information,Alternatively use the LLDB debugger with the llnode v8 plugin; if a core-dump can be captured using an operating-system command such as gcore (on Linux systems) or on application failure and analyse memory usage.
- Unresponsive application, which might indicate a looping or hanging application
An unresponsive Node.js application can be detected if you use watchdog facilities in the production environment, or by the application users themselves.
You can initially use operating-system commands such as ps (on Linux systems) to find out if the application is looping (indicated by high CPU usage) or waiting (indicated by low CPU usage).
Tooling suggestions:
- Use the node-report npm module with signal triggering to obtain a report that provides JavaScript and native C/C++ stack traces of the application state.Use the LLDB debugger with the llnode v8 plugin. Capture a core-dump by using an operating-system command such as gcore (on Linux systems). The LLDB debugger with the llnode v8 plugin can be used to obtain JavaScript and native C/C++ stack traces of the application state. Poor performance
Performance issues are detected in the same way as for an unresponsive Node.js application: by watchdog facilities in the production environment or by the application users themselves. There might be a response-time issue, or excessive use of CPU or memory by the application.
Crash or abort in JavaScript or native code
If a Node.js application crashes or aborts in JavaScript or native code, the symptoms are minimal. The application stops immediately, but usually produces at least a simple message on the stdout or stderr stream. The key diagnostic technique is to capture a core-dump. Operating-system configuration settings such as ulimit (on Linux systems) might be needed for a core-dump to be written.
Tooling suggestions:
- Use the LLDB debugger with the llnode v8 plugin. If a core-dump can be captured, the LLDB debugger with the llnode v8 plugin can be used to obtain a native stack trace showing the point of failure, and allowing other data such as register and memory values to be obtained.
- Unexpected application behavior or functional issue
Symptoms in this case depend on the application, but generally results in incorrect output, observed during routine testing or later by application users.
Installation
In this guide, you will learn how to setup a production Node.js environment on Google Cloud with Ubuntu 18.04 LTS, Nginx and HTTPS.
Install Node.js
You can install the latest LTS release of Node.js
curl -sL x | sudo -E bash –
sudo apt install -y nodejs
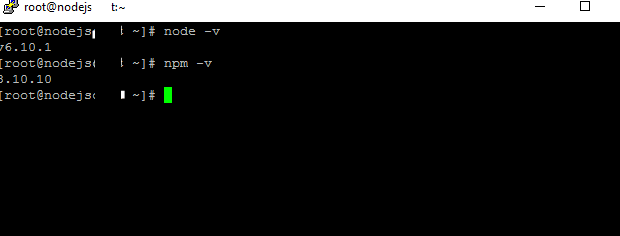
Once the installation is complete you can check the node.js version and npm version using the following commands
node -vnpm -v
Some packages requires compiling from source so you need to install the build-essential package.
sudo apt install build-essential
Create a Node.js Application
Now you can create a demo Node.js app
cd ~/sudo nano server.js
Insert the following code into the file
const http = require(‘http’);const hostname = ‘localhost’;const port = 3000;const server = http.createServer((req, res) => { res.statusCode = 200; res.setHeader(‘Content-Type’, ‘text/plain’); res.end(‘Welcome to Node.js!\n’);});server.listen(port, hostname, () => { console.log(`Server running at
Save the file and exit.
Install Process Manager
sudo npm install pm2@latest -g
Now you can start your app using the process manager
pm2 start server.js
Now your Node.js application is running in the background
Install and Set up Nginx
sudo apt install nginx
Remove default configurations
sudo rm /etc/nginx/sites-available/defaultsudo rm /etc/nginx/sites-enabled/default
Create new Nginx configuration
sudo nano /etc/nginx/sites-available/yourdomainname.com
Paste the following
server {
listen [::]:80;
listen 80;
location / {
proxy_http_version 1.1;
proxy_set_header Upgrade $http_upgrade;
proxy_set_header Connection ‘upgrade’;
proxy_set_header Host $host;
proxy_cache_bypass $http_upgrade;
}
Save and exit the file
Enable your configuration by creating a symbolic link
sudo ln -s /etc/nginx/sites-available/yourdomainname.com /etc/nginx/sites-enabled/yourdomainname.com
Check your Nginx configuration and restart Nginx
sudo nginx -tsudo service nginx restart
Now you can visit your domain name in browser, you should view the output of your server.js (Welcome to Node.js!)
Create SSL certificate and enable HTTP/2
HTTPS
HTTPS is a protocol for secure communication between a server (instance) and a client (web browser). Due to the introduction of Let’s Encrypt, which provides free SSL certificates, HTTPS are adopted by everyone and also provides trust to your audiences.
HTTP/2
HTTP/2 is the latest version of the HTTP protocol and can provide a significant improvement to the load time of your sites. There really is no reason not to enable HTTP/2, the only requirement is that the site must use HTTPS.
sudo add-apt-repository ppa:certbot/certbot
sudo apt-get update
sudo apt-get install python-certbot-nginx
Now we have installed Certbot by Let’s Encrypt for Ubuntu 18.04, run this command to receive your certificates.
sudo certbot –nginx certonly
Enter your email and agree to the terms and conditions, then you will receive the list of domains you need to generate SSL certificate.
To select all domains simply hit Enter
The Certbot client will automatically generate the new certificate for your domain. Now we need to update the Nginx config.
Redirect HTTP Traffic to HTTPS with www in Nginx
Open your site’s Nginx configuration file add replace everything with the following. Replacing the file path with the one you received when obtaining the SSL certificate. listen [::]:80;
listen 80;
;
}
server {
listen [::]:443 ssl http2;
listen 443 ssl http2;
;
ssl_certificate /etc/letsencrypt/live/yourdomainname.com/fullchain.pem;
ssl_certificate_key /etc/letsencrypt/live/yourdomainname.com/privkey.pem;
return 301 ;
}
server {
listen [::]:443 ssl http2;
listen 443 ssl http2;
server_name yourdomainname.com;
ssl_certificate /etc/letsencrypt/live/yourdomainname.com/fullchain.pem;
ssl_certificate_key /etc/letsencrypt/live/yourdomainname.com/privkey.pem;
location / {
proxy_http_version 1.1;
proxy_set_header Upgrade $http_upgrade;
proxy_set_header Connection ‘upgrade’;
proxy_set_header Host $host;
proxy_cache_bypass $http_upgrade;
add_header Content-Security-Policy “img-src * ‘self’ data: blob: https:; default-src ‘self’ g data: ‘unsafe-inline’ ‘unsafe-eval’;” always;
add_header X-Xss-Protection “1; mode=block” always;
add_header X-Frame-Options “SAMEORIGIN” always;
add_header X-Content-Type-Options “nosniff” always;
add_header Access-Control-Allow-Origin “https://yourdomainname.com“;
add_header Referrer-Policy “origin-when-cross-origin” always;
add_header Strict-Transport-Security “max-age=31536000; includeSubdomains; preload”;
}
}
The http2 value is all that is needed to enable the HTTP/2 protocol.
Now you have enabled SSL Hardening, created a Content Security Policy, X-XSS-Protection, Clickjacking, MIME Sniffing, Referrer Policy, Access Control Allow Origin.
These are some Nginx security tweaks by closing all areas of attacks.
Hit CTRL+X followed by Y to save the changes.
Check your configuration and restart Nginx for the changes to take effect.
sudo nginx -tsudo service nginx restart
Renewing SSL Certificate
Certificates provided by Let’s Encrypt are valid for 90 days only, so you need to renew them often. Now you set up a cronjob to check for the certificate which is due to expire in next 30 days and renew it automatically.
sudo crontab -e
Add this line at the end of the file
0 0,12 * * * certbot renew >/dev/null 2>&1
Hit CTRL+X followed by Y to save the changes.
This cronjob will attempt to check for renewing the certificate twice daily.
Now you have installed a production environment of Node.js on Ubuntu 18.04 LTS with Nginx and HTTPS on Google Compute Engine
Overview
Google Compute Engine lets you create and run virtual machines on Google infrastructure. Compute Engine offers scale, performance, and value that allows you to easily launch large compute clusters on Google’s infrastructure. There are no upfront investments and you can run thousands of virtual CPUs on a system that has been designed to be fast, and to offer strong consistency of performance.
You can create virtual machines running different operating systems, including multiple flavors of Linux (Debian, Ubuntu, Suse, Red Hat, CoreOS) and Windows Server!
Follow along this lab to learn about how to create virtual machine instances of various machine types.
What you’ll learn
- Google Compute Engine
- How to create a virtual machine
- Predefined machine types and custom machine types
Monitoring & Diagnostics – Scenarios
Node.js is owned by Node.js(https://nodejs.org/en/) and they own all related trademarks and IP rights for this software.
Cognosys Provides Hardened images of Node.js on the cloud ( AWS marketplace, Azure and Google Cloud Platform).
Deploy Node.js securely on cloud i.e. AWS marketplace, Azure and Google Cloud Platform (GCP)
Secured Node js on Ubuntu 14.04 LTS
Embedded media removed during static cleanup.
Nodejs on cloud for AWS

Features
Major Features of Nodejs
- Event loop
- Unified API
- Package management
- Asynchronous and Event Driven
- Very Fast
- Single Threaded but Highly Scalable
- No Buffering
- License
AWS
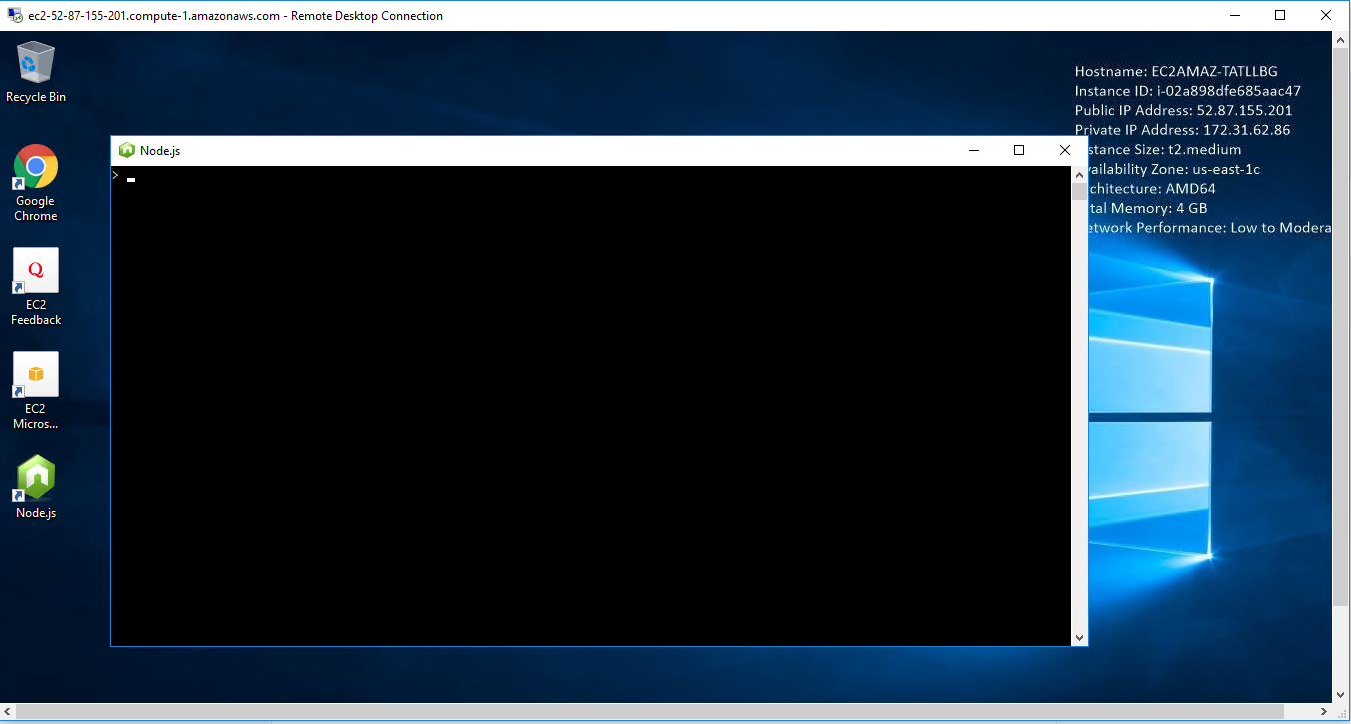
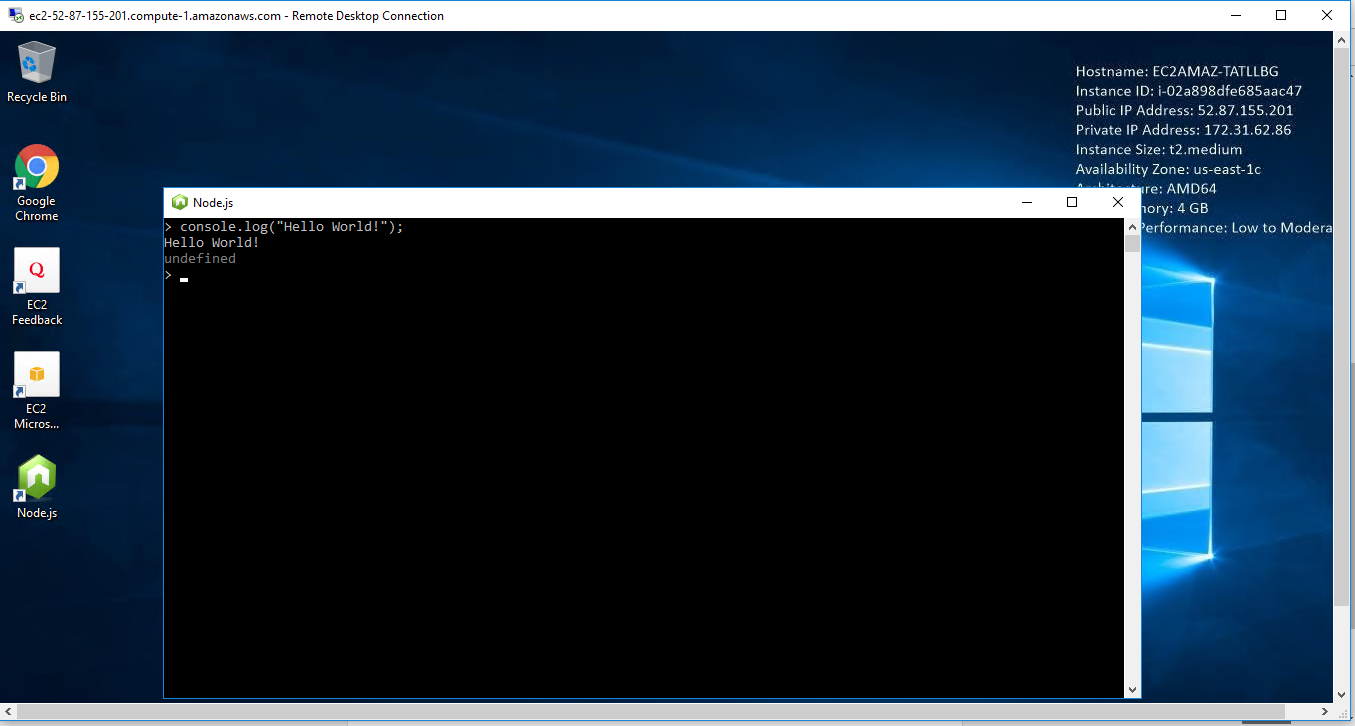
Installation Instructions For Windows
Note : How to find PublicDNS in AWS
Step 1) RDP Connection: To connect to the deployed instance, Please follow Instructions to Connect to Windows instance on AWS Cloud
Connect to virtual machine using following RDP credentials :
- Hostname: PublicDNS / IP of machine
- Port : 3389
Username: To connect to the operating system, use RDP and the username is Administrator.
Password : Please Click here to know how to get password .
Step 2) Application URL: Access the application via a browser at “http:/PublicDNS/Nodejs”
Step 3) Other Information:
1.Default installation path: will be in your root folder “C:\Program Files\Nodejs”
2.Default ports:
- Windows Machines: RDP Port – 3389
- Http: 80
- Https: 443
Configure custom inbound and outbound rules using this link
Installation Step by Step Screenshots

Azure
Installation Instructions For Ubuntu
Note: How to find PublicDNS in Azure
Step 1) SSH Connection: To connect to the deployed instance, Please follow Instructions to Connect to Ubuntu instance on Azure Cloud
1) Download Putty.
2) Connect to virtual machine using following SSH credentials:
- Hostname: PublicDNS / IP of machine
- Port : 22
Username: Your chosen username when you created the machine ( For example: Azureuser)
Password : Your Chosen Password when you created the machine ( How to reset the password if you do not remember)
Step 2) Node.Js V6.10.1 Configuration Information
- A demo node.js application is configured on port 80.
- You can check same on “http://<Your IP>”
- Demo nodejs code is at location “/root/demo_server.js”
- To remove the demo use below commands:
sudo service demo stop
sudo rm /etc/init/demo.conf
Step 3) Other Information:
Version: Node.Js V6.10.1
1. Default installation path: “/var/www/html/”
2.Default ports:
- Linux Machines: SSH Port – 22
- Http: 80
Configure custom inbound and outbound rules using this link
3. To access Webmin interface for management please follow this link
Installation Instructions For Centos
Note: How to find PublicDNS in Azure
Step 1) SSH Connection: To connect to the deployed instance, Please follow Instructions to Connect to Centos instance on Azure Cloud
1) Download Putty.
2) Connect to virtual machine using following SSH credentials:
- Hostname: PublicDNS / IP of machine
- Port : 22
Username: Your chosen username when you created the machine ( For example: Azureuser)
Password : Your Chosen Password when you created the machine ( How to reset the password if you do not remember)
Step 2) Node.Js V6.10.1 Configuration Information
- A demo node.js application is configured on port 80.
- You can check same on “http://<Your IP>”
- Demo nodejs code is at location “/root/demo_server.js”
- To remove the demo use below commands:
sudo systemctl stop demo
rm /etc/systemd/system/demo.service
sudo systemctl daemon-reload
Step 3)Other Information:
Version: Node.Js V6.10.1
1.Default installation path: “/var/www/html/”.
2. Default ports:
- Linux Machines: SSH Port – 22
- Http: 80
Configure custom inbound and outbound rules using this link
3. To access Webmin interface for management please follow this link
Step by step Screenshot :
- Installation Instructions For Windows
- Installation Instructions For Redhat
- Installation Instructions For Centos
Installation Instructions For Windows
Step 1) VM Creation:
1.Click the Launch on Compute Engine button to choose the hardware and network settings.
2.You can see at this page, an overview of Cognosys Image as well as some estimated costs of VM.
3.In the settings page, you can choose the number of CPUs and amount of RAM, the disk size and type etc.
Step 2) RDP Connection: To initialize the DB Server connect to the deployed instance, Please follow Instructions to Connect to Windows instance on Google Cloud
Step 3) Node.Js V6.10.1 Configuration Information
- A demo node.js application is configured on port 80.
- You can check same on “http://<Your IP>”
- Demo nodejs code is at location “/root/demo_server.js”
- To remove the demo use below commands:
sudo service demo stop
sudo rm /etc/init/demo.conf
Step 4) Application URL: Access the application via a browser at http://<yourip>/node.js
A) You will see the page where you can configure your site data with site name, node.js admin name etc.
B) On next page you will see configuration success message.
C) You can login to the node.js admin portal with the node.js username and its generated password from point A shown above.
D) You can access the configured site at http://yourIP/node.js
Step 5) Other Information:
Version: Node.Js V6.10.1
1. Default installation path: “/var/www/html/”
2.Default ports:
- Linux Machines: SSH Port – 22
- Http: 80
3. To access Webmin interface for management please follow this link
Installation Instructions For Redhat
Step 1) VM Creation:
- Click the Launch on Compute Engine button to choose the hardware and network settings.
 2.You can see at this page, an overview of Cognosys Image as well as some estimated costs of VM.
3.In the settings page, you can choose the number of CPUs and amount of RAM, the disk size and type etc.

Step 2) SSH Connection: To connect to the deployed instance, Please follow Instructions to Connect to Ubuntu instance on Google Cloud
1) Download Putty.
2) Connect to the virtual machine using SSH key
- Hostname: PublicDNS / IP of machine
- Port : 22
Step 3) Node.Js V6.10.1 Configuration Information
- A demo node.js application is configured on port 80.
- You can check same on “http://<Your IP>”
- Demo nodejs code is at location “/root/demo_server.js”
- To remove the demo use below commands:
sudo service demo stop
sudo rm /etc/init/demo.conf
Step 4) Application URL: Access the application via a browser at http://<yourip>/node.js
A) You will see the page where you can configure your site data with site name, node.js admin name etc.
B) On next page you will see configuration success message.
C) You can login to the node.js admin portal with the node.js username and its generated password from point A shown above.
D) You can access the configured site at http://yourIP/node.js
Step 5) Other Information:
Version: Node.Js V6.10.1
1. Default installation path: “/var/www/html/”
2.Default ports:
- Linux Machines: SSH Port – 22
- Http: 80
3. To access Webmin interface for management please follow this link
Installation Instructions For CentOS
Step 1) SSH Connection: To connect to the deployed instance, Please follow Instructions to Connect to CentOS instance on Google Cloud
1) Download Putty.
2) Connect to virtual machine using following SSH credentials:
- Hostname: PublicDNS / IP of machine
- Port : 22
Username: Your chosen username when you created the machine
Password : Your Chosen Password when you created the machine ( How to reset the password if you do not remember)
Step 2) Other Information:
1.Default ports:
- Linux Machines: SSH Port – 22
2. To access Webmin interface for management please follow this link
Videos
Secured Node js on Ubuntu 14.04 LTS
Embedded media removed during static cleanup.
Node.js Explained
Embedded media removed during static cleanup.
