1-click AWS Deployment 1-click Azure Deployment
Overview
Logs come in a variety of formats and are stored in multiple different locations. Getting insights from all of these logs isn’t a trivial task. Microsoft Log Parser is a tool that helps us extract such information easily, using a SQL-like syntax. It supports many different input and output formats. But it also has some limitations because of its age.
Introducing Log Parser
According to Microsoft, Log Parser “provides universal query access to text-based data such as log files, XML files, and CSV files, as well as key data sources on the Windows® operating system such as the Event Log, the Registry, the file system, and Active Directory®.” Also, it says, “The results of your query can be custom-formatted in text based output, or they can be persisted to more specialty targets like SQL, SYSLOG, or a chart.”
Installing Log Parser is easy. Just download the installer from Microsoft or use Chocolatey. Log Parser is a command-line tool. If you prefer, you can use Log Parser Studio, a graphical user interface that builds on top of Log Parser. Log Parser Studio also comes with many default queries, which is very useful if you’re using the tool for the first time.
How Log Parser Works
Log Parser will parse a variety of logs in such a way that you can execute SQL-like queries on them. This makes it a useful tool for searching through large and/or multiple logs. Basically, you point Log Parser to a source, tell it what format the logs are in, define a query, and write the output somewhere.An example will make this clear. This query will show us the number of errors per day in the Application event log:
LogParser "SELECT QUANTIZE(TimeGenerated, 86400) AS Day, COUNT(*) AS [Total Errors] FROM Application WHERE EventType = 1 OR EventType = 2 GROUP BY Day ORDER BY Day ASC"
You can run this in the installation folder of Log Parser. But it’s a long statement that we have to keep on one line. It’s also hard to remember. We can put this query in a SQL file and format it nicely like below:
SELECT QUANTIZE(TimeGenerated, 86400) AS Day, COUNT(*) AS [Total Errors]
FROM Application
WHERE EventType = 1 OR EventType = 2
GROUP BY Day
ORDER BY Day ASC
Then we can run this command (assuming the file is named query.sql and stored in the installation folder):
LogParser file:query.sql
On computer, this produces the following result:
Day                 Total Errors
------------------- ------------
2019-03-22 00:00:00 1
2019-04-01 00:00:00 73
2019-04-02 00:00:00 20
2019-04-04 00:00:00 2
2019-04-06 00:00:00 1
2019-04-09 00:00:00 4
2019-04-10 00:00:00 36

Statistics:
-----------
Elements processed: 3138
Elements output:    7
Execution time:     0.04 seconds
If you open yours Event Viewer and check the Application log (under Windows Logs),You will see that these results are correct. For example, you can see that there were four errors on the 9th of April:

If you have access to a remote machine, you can even run Log Parser on your machine but query logs on the remote machine. Just add “\\machinename\” to the “FROM” clause, e.g.:
SELECT TOP 10 *
FROM \\myServer\Application
An IIS Example
We briefly want to show you an example of parsing IIS logs, as many readers probably work with IIS on a regular basis.First, IIS logging must be enabled for your website:

Then you can create some advanced queries. For example, this query can show you the different user agents in all of the log files of a website hosted by IIS:
SELECT cs(User-Agent), count(*) as count
FROM C:\inetpub\logs\LogFiles\W3SVC1\u_*.log
GROUP BY cs(User-Agent)
You can execute the following command to use this query:
LogParser file:"query.sql" -i:W3C -o:DATAGRID
We set up a local website and executed some requests using two browsers and a load testing tool. This is the result:

This is a powerful way to get ad-hoc statistics from your IIS logs: performance, user agents, HTTP response codes, IP addresses, requested addresses, etc. There’s a lot of data to be extracted from IIS logs. Unfortunately, it’s a bit of a hassle to execute your favorite queries every time you want to get some insights. Log Parser has no concept of a dashboard to take a quick glance at the status of your application.
Log Parser Input Formats
In the above query, it seems we selected certain columns from an “Application” table in some database. However, this “Application” points to the Application log of the Windows Event Log. In fact, this is what Log Parser calls an Input Format.
Log Parser has several Input Formats that can retrieve data from
- IIS log files (W3C, IIS, NCSA, Centralized Binary Logs, HTTP Error logs, URLScan logs, and ODBC logs)
- the Windows Event log
- Generic XML, CSV, TSV and W3C formatted text files
- the Windows Registry
- Active Directory Objects
- File and Directory information
- NetMon .cap capture files
- Extended/Combined NCSA log files
- ETW traces
- Custom plugins
In some cases, Log Parser can determine the Input Format for you. In our example, the tool knows that “Application” is an Event Log Input Format. Similarly, Log Parser knows which Input Format to choose when you specify an XML or CSV file.
If Log Parser can’t determine the Input Format, you can specify it with the “-i” option:
LogParser -i:CSV "SELECT * FROM errors.log"
In this case, Log Parser will query the “errors.log” file using the CSV Input Format.To see a complete list of all of the possible Input Formats, consult the help file (“Log Parser.chm”) that you’ll find in the Log Parser installation directory.
Log Parser SQL
Internally, Log Parser uses a SQL-like engine. This gives us the possibility of using SQL to query the logs. I say SQL-like because there are certain functions that aren’t standard SQL. For example, the REVERSE DNS(<string>) function will return the corresponding hostname of an IP address.There are many functions that can make your life easier. It’s too much to mention them all in detail here, but you can find them in the Log Parser help file.
Log Parser Output Formats
Once you have a query with some results, you’ll probably not want to keep writing the output to the command-line. Log Parser supports several Output Formats:
- Text files: CSV, TSV, XML, W3C, user-defined, etc.
- A SQL database.
- A SYSLOG server.
- Chart images in GIF or JPG format.
To write the results to a file, you can simply add the “INTO” clause to your query. To continue with our example, this query will write the results to a CSV file:
SELECT QUANTIZE(TimeGenerated, 86400) AS Day, COUNT(*) AS [Total Errors]
INTO results.csv
FROM Application
WHERE EventType = 1 OR EventType = 2
GROUP BY Day
ORDER BY Day ASC
Just like Input Formats, Log Parser is smart enough to use the correct Output Format in some cases. In our example, the file had a CSV extension. So it makes sense to use the CSV Output Format. If you want to specify the Output Format, you can do so with the “-o” option:
LogParser file:errors_by_day.sql -o:DATAGRID
This will open a window with a data grid:

Log Parser Studio
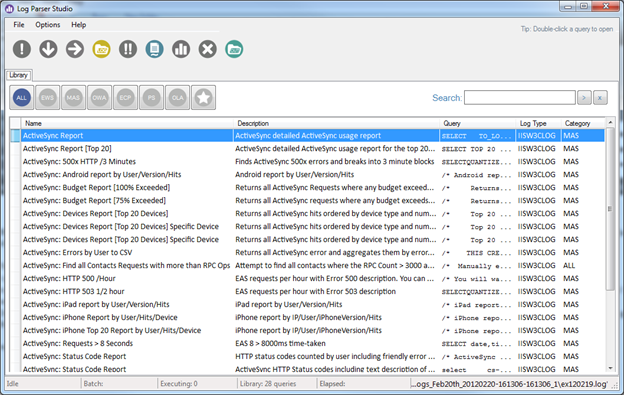
Log Parser Studio is a GUI on top of Log Parser. It contains many default queries that you can modify to fit your needs:

If you’re only getting started with Log Parser, it can be a more convenient way of parsing your logs.
Caveats
Log Parser is a powerful utility that’s not very well-known. It comes with complete documentation in the form of a classic Compiled HTML Help file. This shows its age. The latest version dates back to April 2005.Another potential issue is that the Output Format that produces images of charts requires Microsoft Office Web Components (OWC). However, OWC is only supported up until Office 2003. Even the extended support has been dropped for some time now.
And while Log Parser still works perfectly, it isn’t ideal for the professional user that needs to check logs regularly, wants an easy overview of what’s going on, and needs to pinpoint problems quickly. It’s more of a tool that you can use to write specific queries for specific information that you need at a certain point in time. If you need dashboards and overviews, quick access to detailed information that you need often, or ease-of-use for less tech-savvy people, Log Parser is limited. In such a case, take a look at Scalyr. It supports:
- custom queries
- monitoring Kubernetes
- dashboards
- alerts
- and much more
Log Parser Architecture
Log Parser is made up of three components:
- Input Formats are generic record providers; records are equivalent to rows in a SQL table, and Input Formats can be thought of as SQL tables containing the data you want to process.
Log Parser’s built-in Input Formats can retrieve data from the following sources:- IIS log files (W3C, IIS, NCSA, Centralized Binary Logs, HTTP Error logs, URLScan logs, ODBC logs)
- Windows Event Log
- Generic XML, CSV, TSV and W3C – formatted text files (e.g. Exchange Tracking log files, Personal Firewall log files, Windows Media® Services log files, FTP log files, SMTP log files, etc.)
- Windows Registry
- Active Directory Objects
- File and Directory information
- NetMon .cap capture files
- Extended/Combined NCSA log files
- ETW traces
- Custom plugins (through a public COM interface)
- A SQL-Like Engine Core processes the records generated by an Input Format, using a dialect of the SQL language that includes common SQL clauses (SELECT, WHERE, GROUP BY, HAVING, ORDER BY), aggregate functions (SUM, COUNT, AVG, MAX, MIN), and a rich set of functions (e.g. SUBSTR, CASE, COALESCE, REVERSEDNS, etc.); the resulting records are then sent to an Output Format.
- Output Formats are generic consumers of records; they can be thought of as SQL tables that receive the results of the data processing.
Log Parser’s built-in Output Formats can:- Write data to text files in different formats (CSV, TSV, XML, W3C, user-defined, etc.)
- Send data to a SQL database
- Send data to a SYSLOG server
- Create charts and save them in either GIF or JPG image files
- Display data to the console or to the screen
Transmitting data through a non-secure network might pose a serious security risk to the confidentiality of the information transmitted.For more information on the security risks associated with non-secure networks, see Security Considerations.
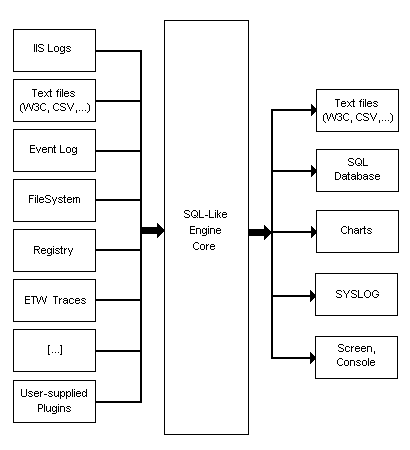
The Log Parser tool is available as a command-line executable (LogParser.exe) and as a set of scriptable COM objects (LogParser.dll).The two binaries are independent from each other; if you want to use only one, you do not need to install the other file on your computer.
Records
Log Parser queries operate on records from an Input Format. Records are equivalent to rows in a SQL table, and Input Formats are equivalent to SQL tables containing the rows (data) you want to process.
Fields and Data Types
Each record generated by an Input Format is made up of a fixed number of fields (the columns in a SQL table), and each field is assigned a specific name and a specific data type; the data types supported by Log Parser are:
- Integer
- Real
- String
- Timestamp
Fields in a record can only contain values of the data type assigned to the field or, when the data for that field is not available, the NULL value.
For example, let’s consider the EVT Input Format, which produces a record for each event in the Windows Event Log.
Using the command-line executable, we can discover the structure of the records provided by this Input Format by typing the following help command:
C:\>LogParser -h -i:ETW
The output of this command gives a detailed overview of the EVT Input Format, including a “Fields” section describing the structure of the records produced:
Fields:
  EventLog (S)              RecordNumber (I)          TimeGenerated (T)
  TimeWritten (T)           EventID (I)               EventType (I)
  EventTypeName (S)         EventCategory (I)         EventCategoryName (S)
  SourceName (S)            Strings (S)               ComputerName (S)
  SID (S)                   Message (S)               Data (S)
From the output above, we understand that each record is made up of 15 fields, and that, for instance, the fourth field of each record is named “TimeWritten” and always contains values of the TIMESTAMP data type.
Record Structure
Some Input Formats have a fixed structure for their records (like the EVT Input Format used in the example above, or the FS Input Format), but others can have different structures depending on the values specified for their parameters or on the files being parsed.For instance, the NETMON Input Format, which parses NetMon capture files, has a parameter (“fMode”) that can be used to specify how the records should be structured. We can see the different structures when we add this parameter to the help command for the NETMON format. The first example shows the fields exported by the NETMON Input Format when its “field mode” is set to “TCPIP” (each record is a single TCP/IP packet), and the second example shows the fields exported by the NETMON Input Format when its “field mode” is set to “TCPConn” (each record is a full TCP connection):
C:\>LogParser -h -i:NETMON -fMode:TCPIP

Fields:
 CaptureFilename (S)    Frame (I)      DateTime (T)      FrameBytes (I)
 SrcMAC (S)             SrcIP (S)      SrcPort (I)       DstMAC (S)
 DstIP (S)              DstPort (I)    IPVersion (I)     TTL (I)
 TCPFlags (S)           Seq (I)        Ack (I)           WindowSize (I)
 PayloadBytes (I)       Payload (S)    Connection (I)

C:\>LogParser -h -i:NETMON -fMode:TCPConn

Fields:
 CaptureFilename (S)          StartFrame (I)          EndFrame (I)
 Frames (I)                   DateTime (T)            TimeTaken (I)
 SrcMAC (S)                   SrcIP (S)               SrcPort (I)
 SrcPayloadBytes (I)          SrcPayload (S)          DstMAC (S)
 DstIP (S)                    DstPort (I)             DstPayloadBytes (I)
 DstPayload (S)
As another example, the CSV Input Format, which parses text files containing comma-separated values, creates its own structure by inspecting the input file for field names and types.
When using the help command with the CSV Input Format, the “Fields” section shows no information on the record structure:
C:\>LogParser -h -i:CSV

Fields:
 Field names and types are retrieved at runtime from the specified input file(s)
However, when we supply the name of a CSV file that, for instance, contains 2 fields (“LogDate” and “Message”), then we can see the structure of the records produced when parsing that file:
C:\>LogParser -h -i:CSV log.csv

Fields:
 Filename (S)       RowNumber (I)       LogDate (T)       Message (S)
Basics of writing a Logparser SQL Query
A basic SQL query must have, at a minimum two basic building blocks: the SELECT clause, and the FROM clause. For starters: start Log Parser Lizard, click on the “New Query” button on the toolbar, from a drop down list select “Windows Event Log” and in the Query text box in the bottom of the window write the following command:
SELECT * FROM System
The SELECT clause is used to specify which input record fields we want to appear in the output. The FROM clause is used to specify which specific data source we want the Input Format to process. Different Input Formats interpret the value of the FROM clause in different ways; for instance, the EVT Input Format requires the value of the FROM clause to be the name of a Windows Event Log, which in our example is the “System” Event Log.
The special “*” wildcard after a SELECT keyword means “all the fields” (like in standard SQL). Most of the times, an output of all of the fields of the log records might not be desired. You might only want to see only the fields that are of your interest. To accomplish this, instead of the “*” wildcard in the SELECT clause, you will have to write a comma-separated list of the names of the fields you wish to be displayed.
SELECT TimeGenerated, EventTypeName, SourceName FROM System.
The Log Parser SQL-Like language also supports a wide variety of functions, including arithmetical functions (e.g. ADD, SUB, MUL, DIV, MOD, QUANTIZE, etc.), string manipulation functions (e.g. SUBSTR, STRCAT, STRLEN, EXTRACT_TOKEN, etc.), and timestamp manipulation functions (e.g. TO_DATE, TO_TIME, TO_UTCTIME, etc.). Functions can also appear as arguments of other functions.
SELECT TO_DATE(TimeGenerated), TO_UPPERCASE( EXTRACT_TOKEN(EventTypeName, 0, ‘ ‘) ), SourceName FROM System То change the name of a field-expression in the SELECT clause by using an alias you can use the AS keyword followed by the new name of the field.
SELECT TO_DATE(TimeGenerated) AS DateGenerated, TO_UPPERCASE( EXTRACT_TOKEN(EventTypeName, 0, ‘ ‘) ) AS TypeName, SourceName FROM System
When retrieving data from an Input Format, it is often needed to filter out unneeded records and only keep those that match specific criteria. To accomplish this task, you can use another basic building block of the Log Parser SQL language: the WHERE clause which is used to specify a Boolean expression that must be satisfied by an input record for that record to be listed in the output. Input records that do not satisfy the condition will be discarded. Conditions specified in the WHERE clause can be more complex, making use of comparison operators (such as “>”, “<=”, “<>”, “LIKE”, “BETWEEN”, etc.) and boolean operators (such as “AND”, “OR”, “NOT”). The WHERE clause must immediately follow the FROM clause.
SELECT TimeGenerated, EventTypeName, SourceName FROM System WHERE ( SourceName = ‘Service Control Manager’ AND EventID >= 7024) The ORDER BY clause can be used to specify that the output records should be sorted according to the values of selected fields. By default, output records are sorted according to ascending values. We can change the sort direction by appending the DESC (for descending) or ASC (for ascending) keywords to the ORDER BY clause.
SELECT SourceName, EventID, TimeGenerated FROM System ORDER BY TimeGenerated
Sometimes we might need to aggregate multiple input records together and perform some operation on groups of input records. To accomplish this, the Log Parser SQL like language has a set of aggregate functions (also referred to as “SQL functions”) that can be used to perform basic calculations on multiple records. These functions include SUM, COUNT, MAX, MIN, and AVG. The GROUP BY clause is used to specify which fields we want the group subdivision to be based on. After the input records have been divided into these groups, all the aggregate functions in the SELECT clause will be calculated separately on each of these groups, and the query will return an output record for each group created.
SELECT EventTypeName, Count(*) FROM system GROUP BY EventTypeName
For filtering results from groups you can use the HAVING clause. The HAVING clause works just like the WHERE clause, with the only difference being that the HAVING clause is evaluated after groups have been created, which makes it possible for the HAVING clause to specify aggregate functions.
SELECT EventTypeName, Count(*) from system group by EventTypeName HAVING EventTypeName =’Error event’
The DISTINCT keyword is used to indicate that the output of a query should consist of unique records. Duplicate output records are discarded. It is also possible to use the DISTINCT keyword inside the COUNT aggregate function, in order to retrieve the total number of different values appearing in the data.
SELECT DISTINCT SourceName from System
SELECT COUNT( DISTINCT SourceName) from System
Use the TOP keyword in the SELECT clause to return only a few records at the top of the ordered output.
SELECT TOP 10 SourceName, Count(*) as Total FROM System GROUP BY SourceName ORDER BY Total DESC
These are simple queries, but they are good example that this log tool is more powerful for analyzing syslog events than any other event log viewer. For more samples, you can always look in examples provided with the program. They don’t all work out-of-a-box but can be very helpful.
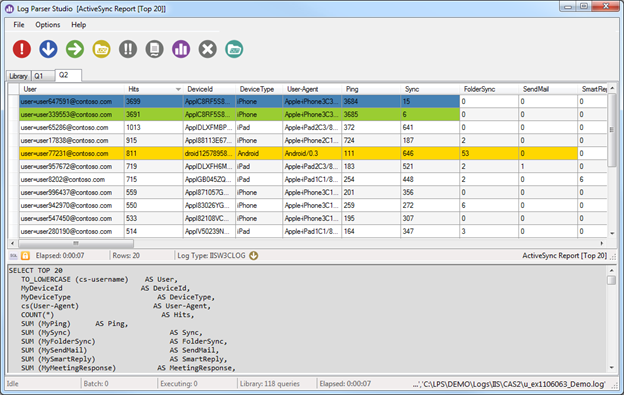
Log Parser Studio was created to fulfill this need; by allowing those who use Log Parser 2.2 (and even those who don’t due to lack of an interface) to work faster and more efficiently to get to the data they need with less “fiddling” with scripts and folders full of queries.With Log Parser Studio (LPS for short) we can house all of our queries in a central location. We can edit and create new queries in the ‘Query Editor’ and save them for later. We can search for queries using free text search as well as export and import both libraries and queries in different formats allowing for easy collaboration as well as storing multiple types of separate libraries for different protocols.
Processing Logs for Exchange Protocols
We all know this very well: processing logs for different Exchange protocols is a time consuming task. In the absence of special purpose tools, it becomes a tedious task for an Exchange Administrator to sift thru those logs and process them using Log Parser (or some other tool), if output format is important. You also need expertise in writing those SQL queries. You can also use special purpose scripts that one can find on the web and then analyze the output to make some sense of out of those lengthy logs. Log Parser Studio is mainly designed for quick and easy processing of different logs for Exchange protocols. Once you launch it, you’ll notice tabs for different Exchange protocols, i.e. Microsoft Exchange ActiveSync (MAS), Exchange Web Services (EWS), Outlook Web App (OWA/HTTP) and others. Under those tabs there are tens of SQL queries written for specific purposes (description and other particulars of a query are also available in the main UI), which can be run by just one click!Let’s get into the specifics of some of the cool features of Log Parser Studio …
Query Library and Management
Upon launching LPS, the first thing you will see is the Query Library preloaded with queries. This is where we manage all of our queries. The library is always available by clicking on the Library tab. You can load a query for review or execution using several methods. The easiest method is to simply select the query in the list and double-click it. Upon doing so the query will auto-open in its own Query tab. The Query Library is home base for queries. All queries maintained by LPS are stored in this library. There are easy controls to quickly locate desired queries & mark them as favorites for quick access later.
Library Recovery
The initial library that ships with LPS is embedded in the application and created upon install. If you ever delete, corrupt or lose the library you can easily reset back to the original by using the recover library feature (Options | Recover Library). When recovering the library all existing queries will be deleted. If you have custom/modified queries that you do not want to lose, you should export those first, then after recovering the default set of queries, you can merge them back into LPS.
Import/Export
Depending on your need, the entire library or subsets of the library can be imported and exported either as the default LPS XML format or as SQL queries. For example, if you have a folder full of Log Parser SQL queries, you can import some or all of them into LPS’s library. Usually, the only thing you will need to do after the import is make a few adjustments. All LPS needs is the base SQL query and to swap out the filename references with ‘[LOGFILEPATH]’ and/or ‘[OUTFILEPATH]’ as discussed in detail in the PDF manual included with the tool (you can access it via LPS | Help | Documentation).
Queries
Remember that a well-written structured query makes all the difference between a successful query that returns the concise information you need vs. a subpar query which taxes your system, returns much more information than you actually need and in some cases crashes the application.
The art of creating great SQL/Log Parser queries is outside the scope of this post, however all of the queries included with LPS have been written to achieve the most concise results while returning the fewest records. Knowing what you want and how to get it with the least number of rows returned is the key!
Batch Jobs and Multithreading
You’ll find that LPS in combination with Log Parser 2.2 is a very powerful tool. However, if all you could do was run a single query at a time and wait for the results, you probably wouldn’t be making near as much progress as you could be. In lieu of this LPS contains both batch jobs and multithreaded queries.
A batch job is simply a collection of predefined queries that can all be executed with the press of a single button. From within the Batch Manager you can remove any single or all queries as well as execute them. You can also execute them by clicking the Run Multiple Queries button or the Execute button in the Batch Manager. Upon execution, LPS will prepare and execute each query in the batch. By default LPS will send ALL queries to Log Parser 2.2 as soon as each is prepared. This is where multithreading works in our favor. For example, if we have 50 queries setup as a batch job and execute the job, we’ll have 50 threads in the background all working with Log Parser simultaneously leaving the user free to work with other queries. As each job finishes the results are passed back to the grid or the CSV output based on the query type. Even in this scenario you can continue to work with other queries, search, modify and execute. As each query completes its thread is retired and its resources freed. These threads are managed very efficiently in the background so there should be no issue running multiple queries at once.
Now what if we did want the queries in the batch to run concurrently for performance or other reasons? This functionality is already built-into LPS’s options. Just make the change in LPS | Options | Preferences by checking the ‘Process Batch Queries in Sequence’ checkbox. When checked, the first query in the batch is executed and the next query will not begin until the first one is complete. This process will continue until the last query in the batch has been executed.
Automation
In conjunction with batch jobs, automation allows unattended scheduled automation of batch jobs. For example we can create a scheduled task that will automatically run a chosen batch job which also operates on a separate set of custom folders. This process requires two components, a folder list file (.FLD) and a batch list file (.XML). We create these ahead of time from within LPS. For more details on how to do that, please refer to the manual.
Charts
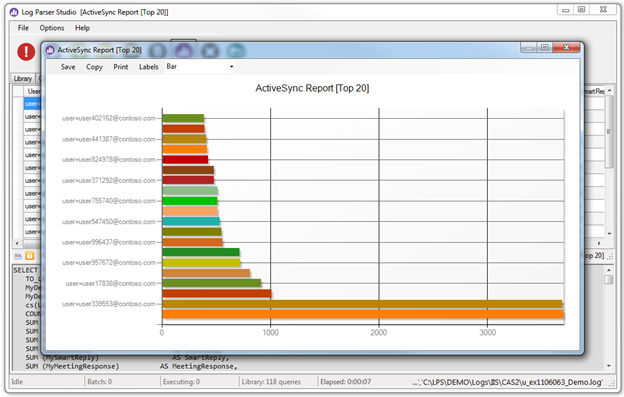
Many queries that return data to the Result Grid can be charted using the built-in charting feature. The basic requirements for charts are the same as Log Parser 2.2, i.e.
- The first column in the grid may be any data type (string, number etc.)
- The second column must be some type of number (Integer, Double, Decimal), Strings are not allowed
Keep the above requirements in mind when creating your own queries so that you will consciously write the query to include a number for column two. To generate a chart click the chart button after a query has completed. For #2 above, even if you forgot to do so, you can drag any numbered column and drop it in the second column after the fact. This way if you have multiple numbered columns, you can simply drag the one that you’re interested in, into second column and generate different charts from the same data. Again, for more details on charting feature, please refer to the manual.
Keyboard Shortcuts/Commands
There are multiple keyboard shortcuts built-in to LPS. You can view the list anytime while using LPS by clicking LPS | Help | Keyboard Shortcuts. The currently included shortcuts are as follows:
| Shortcut | What it does |
|---|---|
| CTRL+N | Start a new query. |
| CTRL+S | Save active query in library or query tab depending on which has focus. |
| CTRL+Q | Open library window. |
| CTRL+B | Add selected query in library to batch. |
| ALT+B | Open Batch Manager. |
| CTRL+B | Add the selected queries to batch. |
| CTRL+D | Duplicates the current active query to a new tab. |
| CTRL+ALT+E | Open the error log if one exists. |
| CTRL+E | Export current selected query results to CSV. |
| ALT+F | Add selected query in library to the favorites list. |
| CTRL+ALT+L | Open the raw Library in the first available text editor. |
| CTRL+F5 | Reload the Library from disk. |
| F5 | Execute active query. |
| F2 | Edit name/description of currently selected query in the Library. |
| F3 | Display the list of IIS fields. |
Supported Input and Output types
Log Parser 2.2 has the ability to query multiple types of logs. Since LPS is a work in progress, only the most used types are currently available. Additional input and output types will be added when possible in upcoming versions or updates.
Supported Input Types
Full support for W3SVC/IIS, CSV, HTTP Error and basic support for all built-in Log Parser 2.2 input formats. In addition, some custom written LPS formats such as Microsoft Exchange specific formats that are not available with the default Log Parser 2.2 install.
Supported Output Types
CSV and TXT are the currently supported output file types.
The very first thing Log Parser Studio needs to know is where the log files are, and the default location that you would like any queries that export their results as CSV files to be saved.
1. Setup your default CSV output path:
a. Go to LPS | Options | Preferences | Default Output Path.
b. Browse to and select the folder you would like to use for exported results.
c. Click Apply.
d. Any queries that export CSV files will now be saved in this folder.
2. Tell LPS where the log files are by opening the Log File Manager. If you try to run a query before completing this step LPS will prompt and ask you to set the log path. Upon clicking OK on that prompt, you are presented with the Log File Manager. Click Add Folder to add a folder or Add File to add a single or multiple files. When adding a folder you still must select at least one file so LPS will know which type of log we are working with. When doing so, LPS will automatically turn this into a wildcard (*.xxx) Indicating that all matching logs in the folder will be searched.
You can easily tell which folder or files are currently being searched by examining the status bar at the bottom-right of Log Parser Studio. To see the full path, roll your mouse over the status bar.
3. Choose a query from the library and run it:
a. Click the Library tab if it isn’t already selected.b. Choose a query in the list and double-click it. This will open the query in its own tab.c. Click the Run Single Query button to execute the query
The query execution will begin in the background. Once the query has completed there are two possible outputs targets; the result grid in the top half of the query tab or a CSV file. Some queries return to the grid while other more memory intensive queries are saved to CSV.As a general rule queries that may return very large result sets are probably best served going to a CSV file for further processing in Excel. Once you have the results there are many features for working with those results.
Log Parser Lizard: Installation and Overview
The name of the tool is Log Parser Lizard from Lizard Labs. There is both a free version and a paid version (including a few extra features) of the application. The listed prerequisites are Log Parser itself (obviously) and version 2.0 of the .NET Framework.
After downloading the MSI, We started the installation process. There were no surprises. It was a standard Windows installation experience. Specify a few options (where to install, etc), hit go, and it’s done. A Log Parser Lizard group was added to the start menu; but no shortcuts were added to the desktop or elsewhere.
Upon running Log Parser Lizard the first time it was presented with an About dialog that explained the tool and asked for support in the form of blog posts, feedback, donations, or a purchased license. Disappointing was the presence of a few grammatical and spelling errors .
The overall appearance of the tool is nice and clean. The main UI has a set of panels on the left-hand side of the application labeled as follows: IIS Logs, Event Logs, Active Directory, Log4Net, File System, and T-SQL. Selecting each of these panels reveals sets of example queries. There are options along the top of the UI that allow users to manage the queries that appear in these panels.
The query management option provides a way to collect and manage log parser queries, which is useful. In my experience using Log Parser I’ve ended up with folders full of saved queries, so it would be nice to have a better way to organize them. A downside I can see is that queries are stored within the application, and I did not find a way to export in the queries in bulk. I imagine this would complicate moving saved queries to a second computer.
When a new query is created, or a existing query is opened (either from a query managed within the application or from an external file), additional options appear for specifying the format of the input file (examples are “IIS W3C Log”, “HTTP Error Log”, and ‘”Comma Separated Values”), setting properties of the query, and executing the query. Query results can be viewed as a grid or a graph, and each of these output formats has multiple options.
There is one more unique feature worth mentioning. In addition to the query management feature, there is an option to manage “Constants” which can be referenced in queries. For example, assume that all of my IIS log files reside in a folder named \\SERVER\Share\. I could set up a constant named “FILEPATH” and assign it a vlaue of \\SERVER\Share\. Then, the constant could be referenced in queries like this: “SELECT * FROM #FILEPATH#ex000000.log”.
—Log parser is a powerful, versatile tool that provides universal query access to text-based data such as log files, XML files and CSV files, as well as key data sources on the Windows® operating system such as the Event Log, the Registry, the file system, and Active Directory.
You tell Log Parser what information you need and how you want it processed. The results of your query can be custom-formatted in text based output, or they can be persisted to more specialty targets like SQL, SYSLOG, or a chart.
Log Parser on cloud for AWS
Features
Some features of Log Parser Lizard :
Use SQL to read logs
Look & Feel
We put a lot of effort into creating a modern Office inspired Multiple Document Interface with ribbons and tabs, to guarantee the best user experience. You want to use an application that looks nice if you spend a lot of time looking at log files.
Query editor
The query editor has syntax highlighting and code auto-completion, code snippets, query constants, inline VB.NET code, and more!
Query Manager
The query management feature provides a nice way to organize Log Parser queries.
Easy Navigation and Data Visualization
The results output in a default table view (data grid) similar to Excel, but with more advanced features at your fingertips. Sorting, grouping, searching, filtering, conditional formatting, formula fields, column chooser, and split view. Additionally, you can transform the data in a Excel, HTML, MHT or PDF report, and consolidate the data into a chart for clearer readability. You can use command line to automate the process.
Data Filtering
From Query Builder and Instant Find to Auto-Filter row. A simple to use Excel inspired UI for creating advanced filter expressions to filter in-memory data.
Open Large Log Files
There is no limit on the size of the file(s) that can be processed with log parser. You may process any number of very large files. Takes only a few seconds to count all rows in gigabytes of log files (depending on your hardware).
Understands Custom Log Formats
Regular Expressions and Grok is currently the best way to parse unstructured log data into something structured and queryable. You can even compress and read logs without unpacking (LPL input types can read compressed and/or encrypted .gz logs). Log4net/log4j XML is also supported out-of-the-box.
Pivot table & tree map
When it comes to data mining and multi-dimensional analysis, an advanced and feature complete pivot table and tree map provides business users unrivaled insights into daily operations.
Easy to use Dashboards
Building dashboards using the designer is a simple matter of selecting the appropriate UI element (Chart, Pivot Table, Data Card, Gauge, Map or Grid) and dropping data fields onto corresponding arguments, values, and series. It’s built so you can do everything inside Log Parser Lizard: from data-binding and dashboard design to filtering, drill down and server side query parameters. Available only in Professional edition.
WYSIWYG Report Designer
WYSIWYG Report Designer is a Microsoft Word® inspired reporting platform, designed to simplify the way in which the users generate business reports. Report designer leverages the intuitive nature of a word processor and integrates the power of a banded report designer into one. Available only in Professional edition.
Printing and Data Export
MS Logparser has built in Extract, transform, and load (ETL) data pipeline, used to collect data from various sources, transform the data according to business rules, and load it into a destination SQL Server data store. In addition, Log Parser Lizard implements powerful printing and data export engine (especially good for Excel files) that supports numerous file formats to export data (XLS, XLSX, PDF, RTF, TXT, MHT, CSV, HTML, Image formats, etc…)
Ready for Big Data
If you are using (or planning to use) Google’s Big Data services (particularly Google BigQuery) to process your large data/log files (IIS or not – doesn’t meter), with Google’s servers doing all the big data heavy lifting, you can use Log Parser Lizard to be able to fly through vast data sets with all the visualization options they’re accustomed to in the software.
Performance
Log Parser Lizard is designed to address your toughest requirements regardless of dataset size and information complexity. The user interface is built for speed – always fast and always responsive.
- -Major Features of Log Parser
- In this version, you can parse the following files very easily from the Log Parser tool: IISW3C, NCSA, IIS, IISODBC, BIN, IISMSID, HTTPERR, URLSCAN, CSV, TSV, W3C, XML, EVT, ETW, NETMON, REG, ADS, TEXTLINE, TEXTWORD, FS and COM.
AWS
- Installation Instructions For Windows
- A) Click the Windows “Start” button and select “All Programs” and then point to Log Parser
- B) RDP Connection: To connect to the operating system,
- 1) Connect to virtual machine using following RDP credentials :
- Hostname: PublicDNS / IP of machine
- Port : 3389
- Username: To connect to the operating system, use RDP and the username is Administrator.
Password : Please Click here to know how to get password . - C) Other Information:
- 1.Default installation path: will be on your root folder “C:\ProgramData\Microsoft\Windows\Start Menu\Programs\Log Parser 2.2”
2.Default ports:
- Windows Machines: RDP Port – 3389
- Http: 80
- Https: 443
- Configure custom inbound and outbound rules using this link
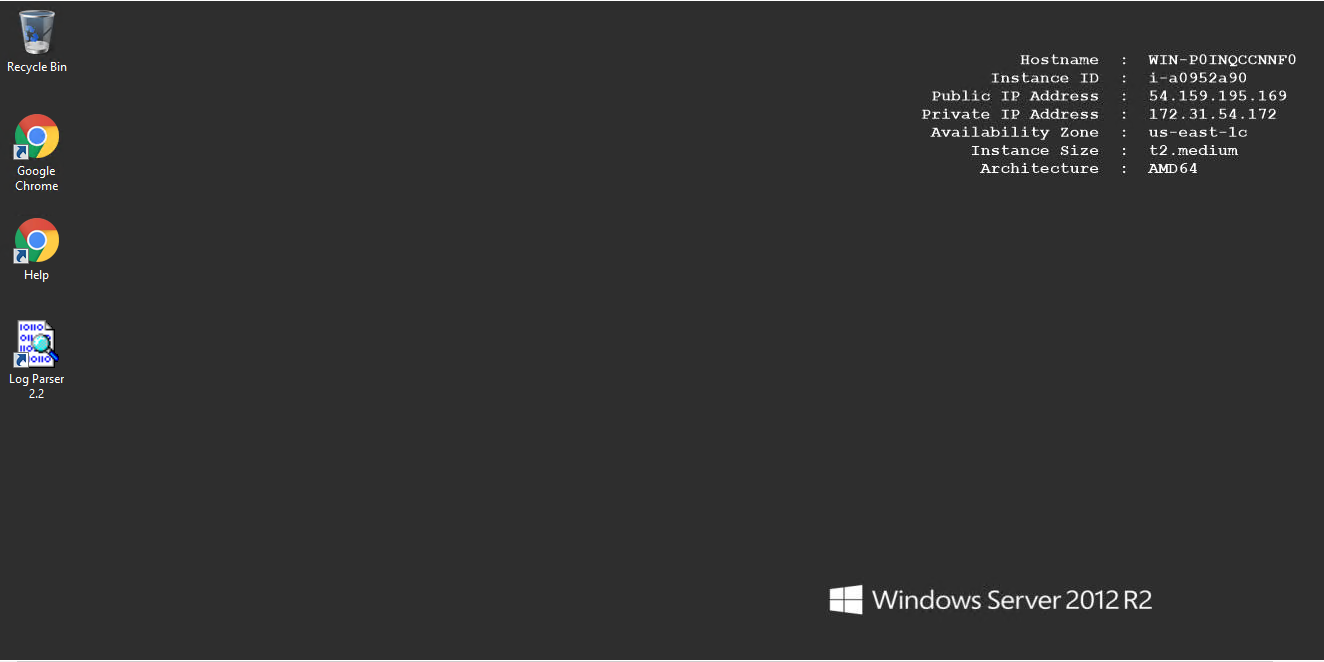
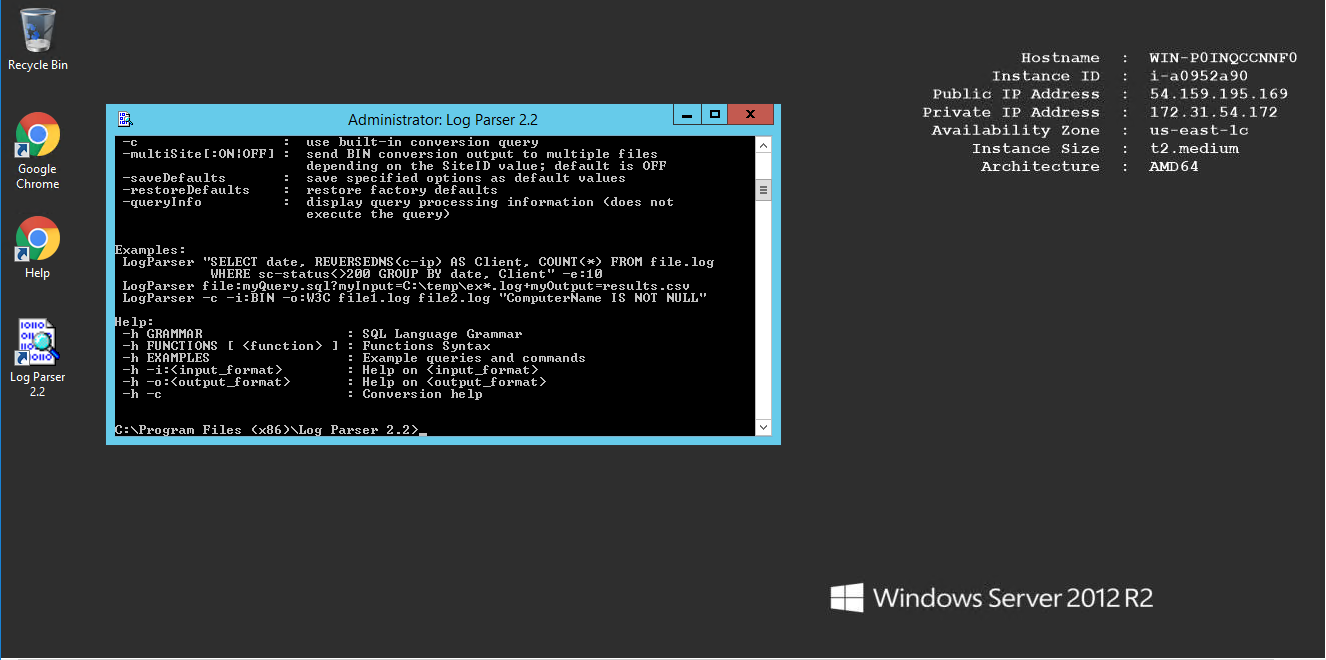
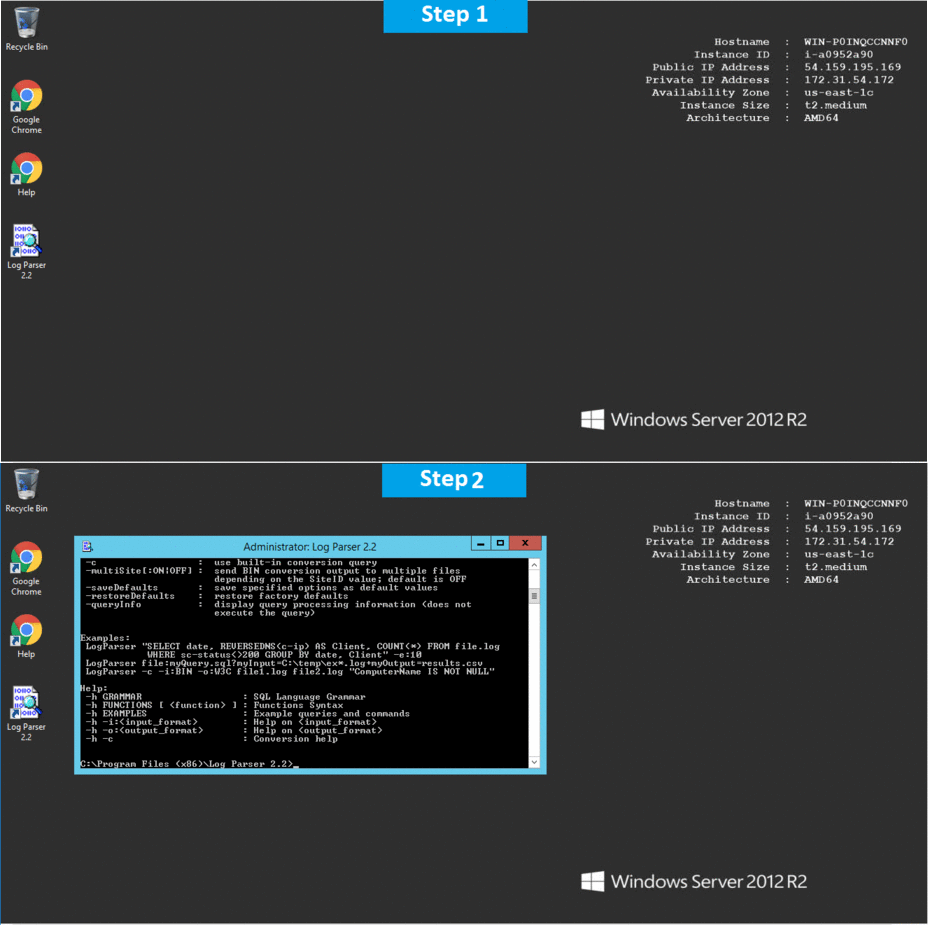
- Installation Step by Step Screenshots


