1-click AWS Deployment 1-click Azure Deployment
Overview
Debugging, in computer programming and engineering, is a multistep process that involves identifying a problem, isolating the source of the problem, and then either correcting the problem or determining a way to work around it. The final step of debugging is to test the correction or workaround and make sure it works.In software development, the debugging process begins when a developer locates a code error in a computer program and is able to reproduce it. Debugging is part of the software testing process and is an integral part of the entire software development lifecycle.
In hardware development, the debugging process typically looks for hardware components that are not installed or configured correctly. For example, an engineer might run a JTAG connection test to debug connections on an integrated circuit.
How debugging works in software
Typically, the debugging process starts as soon as code is written and continues in successive stages as code is combined with other units of programming to form a software product. In a large program that has thousands and thousands of lines of code, the debugging process can be made easier by using strategies such as unit tests, code reviews and pair programming.
To identify bugs, it can be useful to look at the code’s logging and use a stand-alone debugger tool or the debug mode of an integrated development environment (IDE). It can be helpful at this point if the developer is familiar with standard error messages. If developers aren’t commenting adequately when writing code, however, even the cleanest code can be a challenge for someone to debug.
In some cases, the module that presents the problem is obvious, while the line of code itself is not. In that case, unit tests — such as JUnit and xUnit, which allow the programmer to run a specific function with specific inputs — can be helpful in debugging.
The standard practice is to set up a “breakpoint” and run the program until that breakpoint, at which time program execution stops. The debugger component of an IDE typically provides the programmer with the capability to view memory and see variables, run the program to the next breakpoint, execute just the next line of code, and, in some cases, change the value of variables or even change the contents of the line of code about to be executed.
Importance of debugging
Debugging is an important part of determining why an operating system, application or program is misbehaving. Even if developers use the same coding standard, it’s more than likely that a new software program will still have bugs. In many cases, the process of debugging a new software program can take more time than it took to write the program. Invariably, the bugs in software components that get the most use are found and fixed first.
Debugging vs. testing
Debugging and testing are complementary processes. The purpose of testing is to identify what happens when there is a mistake in a program’s source code. The purpose of debugging is to locate and fix the mistake.
The testing process does not help the developer figure out what the coding mistake is — it simply reveals what effects the coding error has on the program. Once the mistake has been error identified, debugging helps the developer determine the cause of the error so it can be fixed.
Examples
Some examples of common coding errors include the following:
- Syntax error
- Runtime error
- Semantic error
- Logic error
- Disregarding adopted conventions in the coding standard
- Calling the wrong function
- Using the wrong variable name in the wrong place
- Failing to initialize a variable when absolutely required
- Skipping a check for an error return
Debugging strategies
Source code analyzers, which include security, common code errors and complexity analyzers, can be helpful in debugging. A complexity analyzer can find modules that are so intricate as to be hard to understand and test. Other debugging strategies include the following:
- Static analysis — the developer examines the code without executing the program.
- Print debugging (also called tracing) — the developer watches live or recorded print statements and monitors flow.
- Remote debugging — the developer’s debugger runs on a different system than the program that is being debugged.
- Post-mortem debugging — the developer only stops to debug the program if it experiences fatal exceptions.
Debugging tools
A debugger is a software tool that can help the software development process by identifying coding errors at various stages of the operating system or application development.
Some debuggers will analyze a test run to see what lines of code were not executed. Other debugging tools provide simulators that allow the programmer to model how an app will display and behave on a given operating system or computing device.
Many open source debugging tools and scripting languages do not run in an IDE, so they require a more manual approach to debugging. For example, USB Debugging allows an Android device to communicate with a computer running the Android SDK.
In this situation, the developer might debug a program by dropping values to a log, creating extensive print statements to monitor code execution or implement hard-coded wait commands that will simulate a breakpoint by waiting for keyboard input at specific intervals.
Challenges of debugging
The debugging process can be quite difficult and require as much work — if not more — than writing the code to begin with. The process can be especially challenging when:
- The negative effect of the coding error is clear, but the cause is not.
- The negative effect of the coding error is difficult to reproduce — for example when web content contains drop down menus.
- Dependencies are not clear, so fixing a coding error in one part of the program accidentally introduces new errors in other parts of the program.
DEBUGGING IN VISUAL STUDIO 2019
1. Attaching the debugger
Debugging in Visual Studio occurs automatically when you run from Visual Studio with F5 or select Debug | Start Debugging.
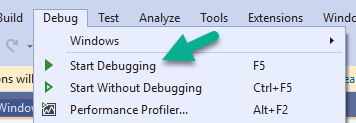
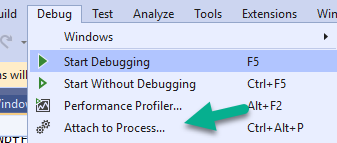
When doing, so Visual Studio attached itself as a debugger to the program. Alternatively, you can attach to a running process with Debug | Attach to Process… (Ctrl+Alt+P).
2. Debugger Break Mode
The debugged process has to be in “Break Mode” for debugging. That means the program is currently paused on a specific line of code. More accurately, all the running threads are paused on a specific line of code.
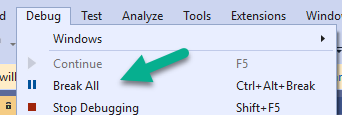
You can get to break mode with Debug | Break All menu item (Ctrl+Alt+Break) or by placing breakpoints.
We’re usually going to use breakpoints because in most debugging scenarios we will want to debug when the program reaches a certain line of code.
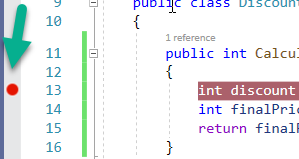
You can place breakpoints by clicking on the margin, pressing F9, or Debug | Toggle Breakpoint. Once set, when your program reaches that line of code, Visual Studio’s debugger will stop execution and enter “Break Mode”:

In break mode, the yellow line represents the next line of code to execute.
3. While in Break Mode – Navigate through code
When in break mode, you can debug interactively and see how your execution of code progresses. The basic features of code navigation are:
- Continue (F5) will quit break mode and continue the program’s execution until the next breakpoint is hit, entering break-mode again.
- Step Over (F10) will execute the current line and break on the next line of code.
- Step Into (F11) is used when the next execution line is a method or a property. When clicked, the debugger will step into the method’s code first line. By default, properties are skipped. To enable stepping into property code go to Tools | Options | Debugging and uncheck Step over properties and operators.
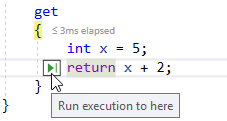
- Run execution to here allows you to continue execution, and break in a specified location without a breakpoint. It’s like creating a breakpoint and removing it after first break. You can do it in 3 ways:
- Hover and click on the green arrow that appears on the start of each line

- Stand on the desired line of code and click Ctrl + F10
- Right click on the desired line of code and click on Set next statement
- Run to a cursor location allows you to forcefully set the next line of code to execute. The current (yellow) line will not be executed. It can be a line that was executed before or after, but it’s best for the new line of code to stay in the current scope. There are 2 ways to do this:
- Drag the yellow arrow to any line of code
- Stand on the desired line of code and click Ctrl+Shift+F10
4. Investigate variables
When in break mode, you can investigate the value of local variables and class members. This is as easy as hovering over a variable:

The hover popup is called a Data Tip. You can get to the same popup by right-clicking the variable and select QuickWatch (Shift+F9 or Ctrl+D, Q) in the context menu.
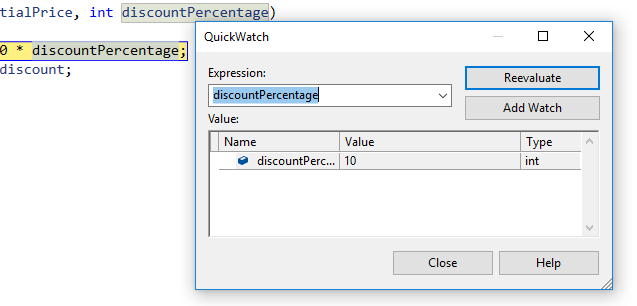
The data-tip and QuickWatch are very similar, except that you can edit the expression in QuickWatch.
An expression is a sequence of variables and operators that evaluate to a single value. For example, discountPercentage is an expression, initialPrice / 100 * discountPercentage is also an expression, literals like "Hello world" and 5 are also expressions.
For complex objects, you can expand into fields and properties.
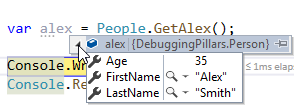
5. DataTip and QuickWatch notable Features
The DataTip and QuickWatch have several useful features:
- Pinning DataTips – You can leave a DataTip pinned to the editor by clicking on the pin icon. Useful when you hit the same breakpoint many times (maybe in a loop)
![]()
- Holding Ctrl will make the DataTip transparent
- By right clicking on an expression in the DataTip, you can open a context menu with several options:
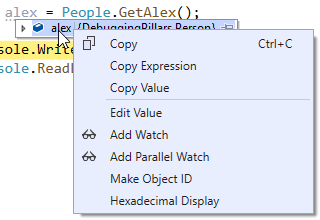
- Copy – Copies to clipboard both Expression and Value (
alex = {DebuggingPillars.Person}) - Copy Expression – Copies expression (
alex) - Copy Value – Copies expression (
{DebuggingPillars.Person}) - Edit Value – A useful feature where you can change the value during debugging. Most useful for primitives (strings, integers, etc.).
- Add Watch – Adds expression to Watch window (more on that later)
- Add Parallel Watch – Adds expression to Parallel Watch window (more on that later)
- Make Object ID – Creates a scope-independent expression that starts with ‘$’ (
$1,$2, and so on). You can evaluate this expression at any time, regardless of the current scope, in QuickWatch, Watch Window or the Immediate Window. A very useful feature and can be used to detect memory leaks.
6. Breakpoint advanced features
The breakpoints has several very useful lesser known features. By right-clicking a break you will see a context menu:
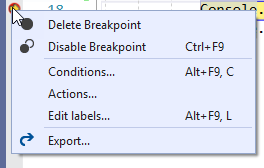
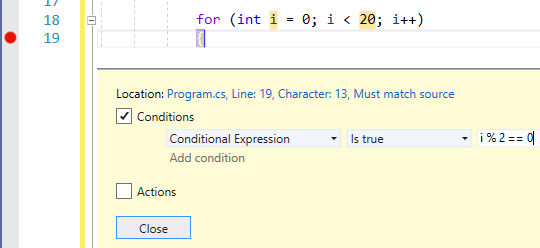
- Conditions allows you to break on this breakpoint only when a condition is met. For example, when in a loop I can break only on even numbers:
- Actions allow you to log a message to the output window whenever the breakpoint is hit. You can continue execution, without stopping on the breakpoint.
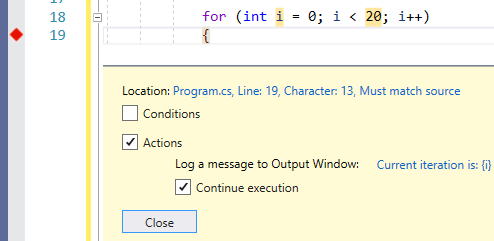
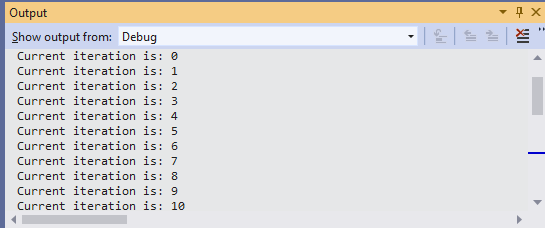
This is most useful when debugging multi-threaded scenarios. More on multi-threading debugging later.
- Edit labels… allows to categorize breakpoints into labels. This makes it easier later to organize them in the breakpoints tool window:

Debugging in Visual Studio Code
The broken calculator
Here’s a page that contains a couple of common JavaScript mistakes.

The page is supposed to take two numbers (in two text boxes), add them together, and show the result. Unfortunately, the math doesn’t make sense. Clearly, there’s a gap between what we expect it to do and what actually takes place.
Here’s the code that does the adding when you click the button:
function addNumbers() {
  // Get the numbers out of the text boxes.
  var numberA = document.getElementById("numA").value;
  var numberB = document.getElementById("numA").value;  // Perform the calculation.
  var result = numberA + numberB;  // Show the result on the page.
  document.getElementById("result").innerHTML = result;
}
If you’ve been programming for more than a hot minute, you can probably spot both mistakes pretty quickly. But we’re more interested in exposing the problem with the VS Code debugging tools.
To follow along, you can download the broken calculator example. Once again, you’ll need the Chrome debugger, but that’s it — this project already has a .json file that switches on local debugging.
Single-step execution
One of the greatest tools in any programming language is the ability to step through your code. This feature allows you to watch your program in action, one line of code at a time.
To use this feature, you need to pick a place where you want to pause your code. You do this by adding a breakpoint — basically, a flag that tells Visual Studio “stop right here.” In the broken calculator example, the code is simple enough that you’ll probably want to step through the entire function. In other situations, you might want to skip over irrelevant or time-consuming parts by putting your breakpoint later.
To set your breakpoint, click in the margin to the left of the code line numbers. For example, to set a breakpoint at the beginning of the addNumbers() function, click next to line 2, which looks like this:
var numberA = document.getElementById("numA").value;
Now you’ll see a red circle appear next to the line you’ve marked:

To remove a breakpoint, click the red circle.
Unlike some development environments, VS Code lets you put breakpoints anywhere, even on variable declarations, comments, and blank lines. However, you can’t put a breakpoint on the function declaration (so in this example, a breakpoint isn’t allowed on line 1).
Now run your program in debug mode (choose Debug→Start Debugging from the menu or just press F5). Assuming you’re using the sample project, or you’re using your own project with a properly configured .json file, VS Code will launch Chrome and show your page.
Everything starts out normally in the broken calculator. But when you click the Add Numbers button, VS Code hits your breakpoint and pauses your code. Often (but not always), VS Code will shade the browser window and add a yellow message to indicate when your code has been interrupted by a breakpoint:

Now it’s time to switch back to the VS Code editor.
When VS Code reaches a breakpoint, it won’t execute that line of code. Instead, it puts a yellow arrow next to the line, indicating that this is the next instruction to be executed when the program resumes. You’ll also see a tiny toolbar that gives you quick access to some key debugging commands.
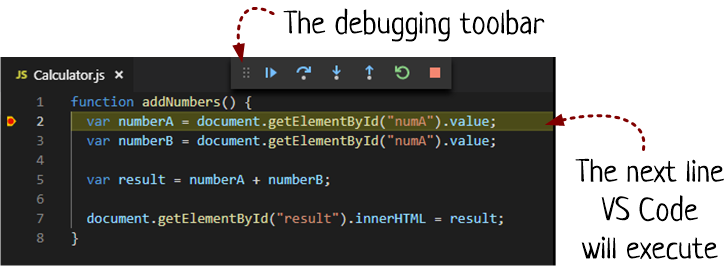
While your program is paused, you can use the commands described in the following sections. All of these commands have useful shortcut keys. They’re also all in the debugging toolbar (just hover over the icons to find out what’s what).
Continue (F5)
This command resumes the program and continues to run it normally, without pausing unless it hits another breakpoint.
Step Over (F11)
The Step Over command takes a single step. It executes the currently highlighted line, and then pauses again. If you try it in the current example, VS Code executes line 2, grabbing the value from the first text box. It then pauses just before executing line 3, which is supposed to get the number from the second text box:

Now you can hit F11 to take another step, and so on, until you march through the entire function one line at a time.
The “over” in Step Over refers to how this command works with function calls. If you use Step Over to execute a line of code that calls a function, VS Code runs the entire function, and pauses at the line underneath.
Step Into (F10)
The Step Into command works the same as Step Over, except when it hits a function. Then, Step Into goes into that function and pauses on the first line inside.Here’s the trick, though — this only works if the function is part of your code. You can’t step into something like the getElementById() function, because that’s a built-in part of the browser’s web page model.
In fact, in this example there’s no difference between using Step Into and Step Out. But if you write a function that called another function, you could use Step Into to travel from one place to another in your code, without skipping any details.
Step Out (Shift+F11)
The Step Out command executes all the code in the current function, and then pauses at the next statement (if there is one). In other words, it allows you to step out of the current function in one large jump.In the broken calculator example, Step Out is almost the same as calling Continue. Why? The addNumbers() function wasn’t called by another function. Instead, addNumbers() was called directly from the onclick event in the HTML markup.
If you use Step Out in this case, VS Code takes you to the HTML page markup to show you where the event handler is attached:
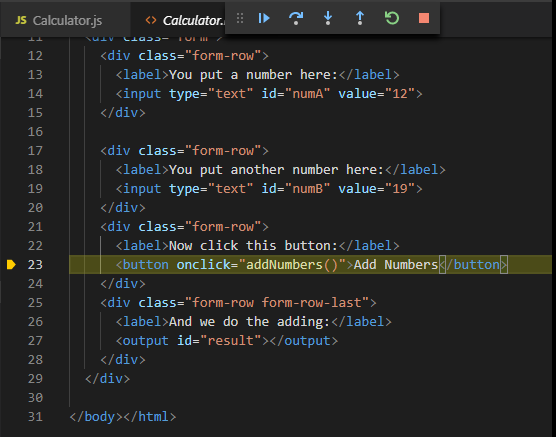
After that, there’s nothing else to do, so you may as well press F5 to continue on normally.
Stop (Shift+F5)
The Stop command is self-explanatory. This stops debugging, closes the browser, and lets you make your edits in VS Code.
Spying on variables
Single-step execution is a great way to follow through complicated logic. For example, you can find out how many times your code goes around a loop or which path your code takes through a block of conditional logic. But if you want to find out what’s gone wrong in a buggy program, you need to also look at the your application’s state — in other words, what it’s holding in memory.Debug mode makes this easy. When your code is paused, you can hover over any of your variables with the mouse cursor to see what it currently contains. For example, if you move the mouse over the numberA variable immediately after the breakpoint is hit, here’s what you’ll see:
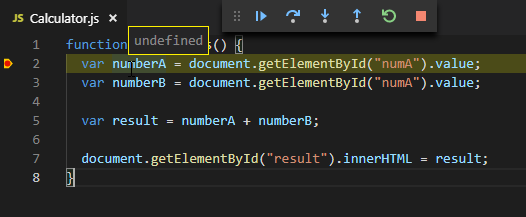
Remember, the breakpoint stops execution just before the line runs. In this example, nothing has happened yet, so it’s no surprise that numberA is “undefined.”
Now press F11 (Step Over) to run a single line of code and take another peek at numberA. You’ll see a box with the value “12”:
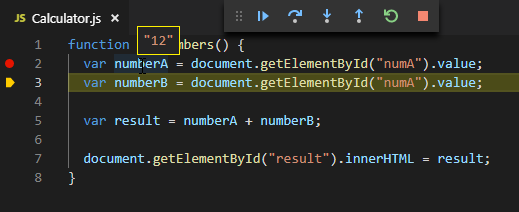
It’s important to understand that when you peek into a variable, you always see its current state. It doesn’t matter where you are in the code. For example, there’s no difference if you hover over numberA in line 2 or line 5, either way VS Code shows you what it holds right now. Similarly, if you hover over the result variable in line 5, it will be empty, because that line of code hasn’t been executed yet.
Fixing the broken calculator
Variable peeking is the secret to unraveling the first problem in the broken calculator example. Press F11 to run one more line, and look at the numberB variable. You’ll see that it has the same value as numberA.

Clearly, line 3 has a problem — it grabs the information from the wrong text box. Fortunately, the fix is easy. You simply need to correct the name that’s used to find the text box, by replacing numA with numB:
var numberB = document.getElementById("numB").value;
Once you’ve made this fix, you need to stop the program (Shift+F5), and start debugging again (F5). (VS Code will save the changed code for you automatically when you restart.)
If you keep stepping along, you’ll run into the second problem. The result of adding the two numbers (in this example, 12 and 19), gives you the long bit of text 1219 instead of proper answer 31. You can quickly home in on the problem using variable peeking after VS Code performs the calculation:

The problem is that this code is working with bits of text (like “12”) instead of numbers (like 12). When you use the plus sign on bits of text, JavaScript simply joins them together. To solve this problem, you need to translate both pieces of text into numbers, and then add those values.
There are several ways to convert text to numbers in JavaScript, with subtle differences in how they deal with bad data (text that doesn’t really have numbers in it). But here’s one example of how you might make a quick fix for this example using JavaScript’s Number() function:
var result = Number(numberA) + Number(numberB);
Of course, in this example the fix isn’t what’s important. The real benefit is developing your debugging skills.
VS Code has several more advanced debugging tools. For example, you can create watches that track the values of certain variables, examine the call stack to figure out where you are in deeply layered code, and create conditional breakpoints that only trigger when certain conditions are met.But single-step execution and variable peeking are the two core debugging tools that make everything else possible. With them, you never need to give up altogether when you face mysterious problem. Instead, you can always crack open your debugging toolkit and take a look behind the scenes.
Debugging Tools in Visual Studio
What is auxiliary metadata?
It is a collection of different symbols; and those symbols are used by the Visual studio debugger to fetch all the required data.
This file can be created by CLR when we build the project, once the project is build we can see that file inside projectsolution under bin->debug folder.
There we find different type of file as given bellow:

In the above fig I have marked one file that is the symbol file.and file extensions of this file is .pdb.
.pdb stand for Program debug database file.
This file contails all the information about the debugging i.e line number, symbols used for step in , step out and many more. All this information is stored inside in the form of binary data.The main purpose of pdb file is to store all the information about the debugging process.This is all aboutpdb file and uses now let’s move to the next;
Source server and its uses
Maybe or maybe not, if we think logically we may answer no because to debug anything we require the source code must be present in local machines or remote machine,so in the case of .net framework code debug we don’t have such a file in our machines, only we have dll so the answer is no but we can.Yes, this is possible through using Source server feature given in VS.Source server is basically a server provided by Microsoft , it contains all the symbolic instruction to debug .net frame work code.The Source server allows us to debug the .net frame work code in VS , using this we can step in to any core method of .net frame work.
How to enable source sever in Visual Studio ?
Step 1: Go to the debug menu and click their option-setting.

Step 2: Then it will open new windows where we need to checked “Enable .Net source stepping” and “Enable source server”.

Step 3: After doing this we need to select “Symbols” option and there we need to give the new location inside the symbol file location, this is the main important thing to specify the location because from that location VS read the pdb file for .net framework to debug.
To give a new location follow the below steps:
Step 1: First select Symbols option then Click on the button arrow mark below to add new location,

Step 2: Specify the location and then click ok.
Now what is going to happen is that visual studio reads all the .net frame work symbol file from that location.
Note: To work above settings you must connected to the INTERNE , because now your VS connects with the Microsoft .Net framework source server and reads all the symbols from there.
Warning: After doing this setting, when you execute any of your applications VS takes some time depending upon your internet connection type and it loads all the symbol files from server so you need to wait for that.
Once it has loaded all the symbols then we can go step into for .net framework code.
This is all about your .net Framework code debugging process.
Now let’s move Thread debugging tool in Visualstudio:
This is a very useful tool while we are working with multiple threads.
To see all the threads currently executing we have a thread window in debug menu.
Thread window provides lots of information about the thread .
To see all the information about the thread we need to execute any thread program.
For our understanding purposes I created a windows form application and implement the thread as bellow:
Created a simple window form and place a button inside it as below:

Under button click event I write the following code:
- privatevoid button1_Click(object sender, EventArgs e)
- {
- for (int i = 0; i < 30; i++)
- {
- Threadth = newThread(delegate()
- {
- lock(this)
- Thread.Sleep(1000);
- });
- th.Start();
- }
- }
Then I start my application and click on the button, create thread, and leave the application in running mode and come to Visual Studio and inside Visual Studio I click on the break all option from the debug menu then to see all the thread information I click on thread window as given below:

Then click thread window:

Then we see all the information about thread which have started ;for my apps below is the thread window figure.

Now to see all this thread more clearly we need to move to our next topic i.e, parallel stack window for thread.
The parallel stack window for thread is used to give a more clear picture of thread with Diagram.
To open parallel stack window we need to do the same process. What we do above i.e start our windows from apps then click on the button , next click on break all option then go to window and click on parallel stack windows as given bellow:

Then you get a visualization window for all the threads, whichever is currently running for my example, below is the figure,

To finding the specific thread we can use the thread name or thread id from the thread window, also thread window allows us to rename the thread name.
This is all about thread debugging tools which is very useful; for multithreading application, try this feature.
–The Visual Studio debugger helps you observe the run-time behavior of your program and find problems. The debugger works with all Visual Studio programming languages and their associated libraries. With the debugger, you can break execution of your program to examine your code, examine and edit variables, view registers, see the instructions created from your source code, and view the memory space used by your application.
Features
5 Awesome Visual Studio Debugger Features
1. Step Out of the Current Function
So you’ve written a function call, like so:
|
1
2
3
4
5
6
|
int main(){ Data d; std::cout << compute_average( d.getSum(), d.getCount() ) << std::endl;} |
And the compute_average function is not returning the correct value. If you were to use a debugger, and you wanted to step into compute_average, you could, of course, put a breakpoint inside compute_average, but what if it were called from several places? Visual Studio has a very convenient feature of its debugger, that will allow you to step into compute_average very quickly.
Set a breakpoint on that line:
 Once the debugger hits it, then step into the function. getSum and getCount will both be called before compute_average. Normally, you’d keep hitting next to get out of getSum and getCount, but with Visual Studio, you can quickly hit Shift-F11 to step out of the current function and return to the next call.
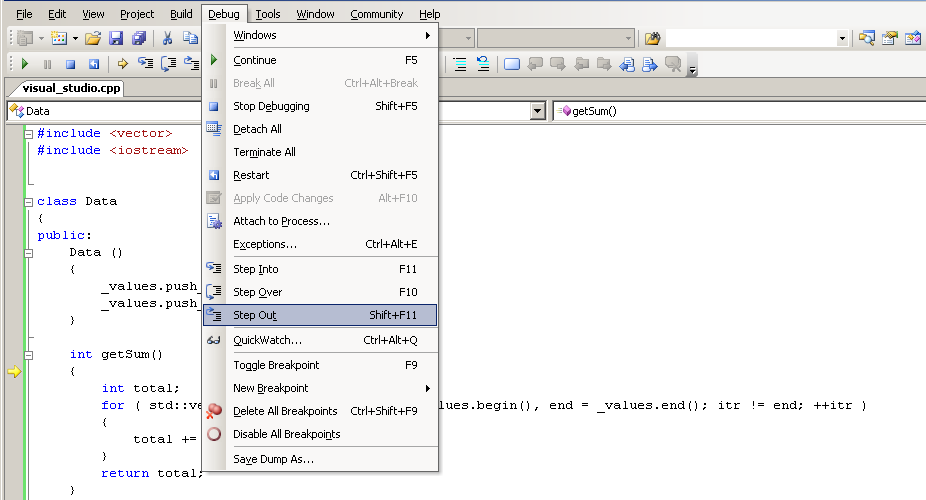 Once you step out of the current function, you’re taken back to the original breakpoint. But now you can step in again, to go to the next function. Repeat until you’ve drilled down into the function you want.
When to Use This Trick
Obviously, there are times when it makes more sense to just set a breakpoint in your target function. But when doing so would require ignoring hundreds of calls to that function to find the one you want, it might not be worth it. Using step out provides a quick way of getting into a function without having to find the function and set a temporary break point (or use run to cursor).
2. Use the Auto Window to See Result of Functions
One of the most frustrating parts of debugging is when you have a function call whose result isn’t stored anywhere, and you really want to know what it returned.
Sometimes, programmers write code like this, just to work around the issue:
|
1
2
3
4
5
|
int computed_avg;computed_avg = compute_average( d.getSum(), d.getCount() );std::cout << computed_avg << std::endl; |
(Obviously, in this case, the program prints out the value, so all is not lost. This is rarely true in the general case.)
Fortunately, the autos window has good courtesy to display the result of a function evaluation:
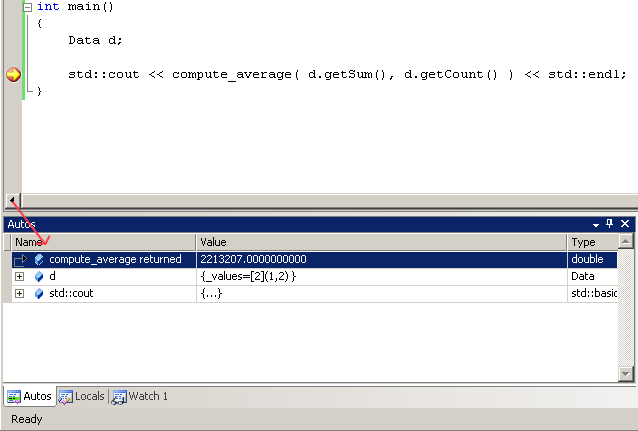
When to Use this Trick
Whenever you want to see a return value! Note that you the autos window will eventually erase the return value as you execute code, so be sure to check your return value immediately.Most return values are also stored in the EAX register–you can look in EAX to find the return value, if you need it.
3. Run to Cursor
Run to cursor is a great way of avoiding the step-step-step-step-step-oh-no-I-stepped-over-it problem, where you know where you want to be, getting to it requires stepping multiple times, and you get impatient.
In effect, run-to-cursor is just a shortcut for setting a breakpoint that is immediately cleared once it’s hit; nevertheless, it’s a very convenient feature. It is most useful when you have a piece of code that is called frequently from different places, and you only care about one code path. Then you can place a breakpoint at the start of that path and use run-to-cursor to get to the point you really care about.
Going back to our sample program, we can use run-to-cursor rather than the step-out trick, to get into compute_average. (Of course, we could just put a breakpoint in compute_average; for the purpose of making this example sensible, please imagine 15-20 calls to compute_average that all work correctly, taking place before the broken call.)

When to Use this Trick
Any time you want a throwaway breakpoint or want to avoid single-stepping through a lot of code. Be careful, though, that you run to a part of the code that will actually be executed. Watch out for early returns from a function within a loop, for instance.
4. Modify Any Variable
Now that we’re in the compute_average function, and we know that the value being returned is waayyy too big, we can check the arguments to the function. It turns out that sum is very large. We’ll deal with that in a bit. First, let’s test and make sure that the function works if we do get the right value.
Obviously, one way of doing this would be to pass in a new value. But Visual Studio conveniently makes it easy to change any value in memory. In fact, let’s do that with the value of sum, and make sure that it returns the correct value.
All you need to do is click on in the Value column of the auto or watch window and change the value. (You can also do this when the variable’s value pops up while hovering over a variable in the source code.)
 and :
and :
 Continuing execution of the program demonstrates that, in fact, we still get the wrong answer–this time, it returns the value 1. This suggests that truncation is taking place due to integer division.
Before recompiling, we can add in a cast to solve this problem:
|
1
|
return (double) sum / count; |
When to Use this Trick
This trick is powerful, and is particularly helpful when you have found one bug, but want to prove that the rest of your code will work. This is particularly handy when your debugging session requires a great deal of setup–for instance, you have to perform a lot of UI to get the right inputs or your code takes a long time to build. (An alternative would be to consider writing a unit test that demonstrates the bug and doesn’t require so much setup.)
On the other hand, you can’t rely on this trick when you are inside a loop or a function that is called frequently–it’s just too much of a pain to have to manually set variables all the time.
5. Set Next Statement
Set Next Statement is a real power tool. If you’re debugging, and you’ve accidentally (or not so accidentally) stepped past the point where something interesting happens, you can sometimes “unwind” execution. What this really means is that, maintaining the current state of the world, you can tell Visual Studio to go back and start executing from a previous instruction.
You can also use set next statement to jump over code that you believe is buggy, or to jump past a conditional test on an if statement to execute a path of code that you want to debug without having to make the condition true.
Setting the next statement can be dangerous and lead to instability if the stack or registers aren’t in a valid state for the line being executed. And because it won’t restore the state of the world, if your code depends on that state, changing the next statement might not be useful. On the other hand, if you want to make a call that you’re pretty confident won’t behave differently, it can be a great way of avoiding recreating a specific failure just because you accidentally stepped too far.
For instance, take the following debugging state, where you’re about to return the value total from getSum:
 If you had accidentally run too far, it might be very convenient to be able to simply say, ok, let’s start that again:
 and then you can go back through executing the loop, perhaps setting the value of total to 0, since you notice that it wasn’t initialized, and then checking to see if the program gives the correct sum (in which case, you can be pretty confident that the lack of initialization was the problem).

When to Use this Trick
Many of the same considerations that apply to resetting variable values also apply here. However, you should also be aware that the further ahead or back in a function you set the next statement, the more likely the debugger will not be able to compensate and your program will crash.
Major Features of Visual Studio debugger
Unfortunately bugs are a part of software development, and despite our best efforts to write software correctly from the start we spend a lot of time in the debugger. While bugs are an unfortunate fact of life, finding them doesn’t have to be as painful as it often is. For you problem-solvers out there, the Visual Studio 2015 debugger contains a rich set of features that can really increase your productivity…assuming you know they exist, and how to use them! To help with you learn more about our debugging tools, I recently gave three talks on “Debugging Tips and Tricks for .NET developers”, at Microsoft’s Build Conference (60 minutes), at Microsoft’s Ignite Conference (75 minutes), and most recently on Visual Studio Toolbox (38 minutes). So check them out!
Videos
Debugging with VisualStudio 2015


