1-click AWS Deployment 1-click Azure Deployment
Overview
A profiling session is created for each instance of a role in your cloud service. To view your profiling reports of each session from Visual Studio, you can view the Server Explorer window and then choose the Azure Compute node to select an instance of a role. You can then view the profiling report as shown in the following illustration.
Visual Studio provides a variety of profiling tools to help you diagnose different kinds of performance issues depending on your app type. The profiling tools that you can access during a debugging session are available in the Diagnostic Tools window.
You can test the performance of a cloud service in the following ways:
- Use Azure Diagnostics to collect information about requests and connections, and to review site statistics that show how the service performs from a customer perspective. To get started with , seeUse the Visual Studio profiler to get an in-depth analysis of the computational aspects of how the service runs. As this topic describes, you can use the profiler to measure performance as a service runs in Azure. For information about how to use the profiler to measure performance as a service runs locally in a compute emulator,
Choosing a performance testing method
- Statistics on web pages or services, such as requests and connections.
- Statistics on roles, such as how often a role is restarted.
- Overall information about memory usage, such as the percentage of time that the garbage collector takes or the memory set of a running role.
Use the Visual Studio profiler to:
- Determine which functions take the most time.
- Measure how much time each part of a computationally intensive program takes.
- Compare detailed performance reports for two versions of a service.
- Analyze memory allocation in more detail than the level of individual memory allocations.
- Analyze concurrency problems in multithreaded code.
Collect profiling data locally to:
- Test the performance of a part of a cloud service, such as the execution of specific worker role, that doesn’t require a realistic simulated load.
- Test the performance of a cloud service in isolation, under controlled conditions.
- Test the performance of a cloud service before you deploy it.Test the performance of a cloud service privately, without disturbing the existing deployments.
- Test the performance of the service without incurring charges
Collect profiling data in Azure to:
- Test the performance of a cloud service under a simulated or real load.
- Use the instrumentation method of collecting profiling data, as this topic describes later.
- Test the performance of the service in the same environment as when the service runs in production.
Profiler collection methods
You can use different collection methods for profiling, based on your performance issues:
- CPU sampling – This method collects application statistics that are useful for initial analysis of CPU utilization issues. CPU sampling is the suggested method for starting most performance investigations. There is a low impact on the application that you are profiling when you collect CPU sampling data.
- Instrumentation -This method collects detailed timing data that is useful for focused analysis and for analyzing input/output performance issues. The instrumentation method records each entry, exit, and function call of the functions in a module during a profiling run. This method is useful for gathering detailed timing information about a section of your code and for understanding the impact of input and output operations on application performance. This method is disabled for a computer running a 32-bit operating system. This option is available only when you run the cloud service in Azure, not locally in the compute emulator.
- .NET Memory Allocation – This method collects .NET Framework memory allocation data by using the sampling profiling method. The collected data includes the number and size of allocated objects.
- Concurrency – This method collects resource contention data, and process and thread execution data that is useful in analyzing multi-threaded and multi-process applications. The concurrency method collects data for each event that blocks execution of your code, such as when a thread waits for locked access to an application resource to be freed. This method is useful for analyzing multi-threaded applications.
- You can also enable Tier Interaction Profiling, which provides additional information about the execution times of synchronous ADO.NET calls in functions of multi-tiered applications that communicate with one or more databases. You can collect tier interaction data with any of the profiling methods. For more information about tier interaction profiling,
To configure profiling settings
In Solution Explorer, open the shortcut menu for your Azure project, and then choose Publish. For detailed steps about how to publish a cloud service,
In the Publish Azure Application dialog box, chose the Advanced Settings tab.
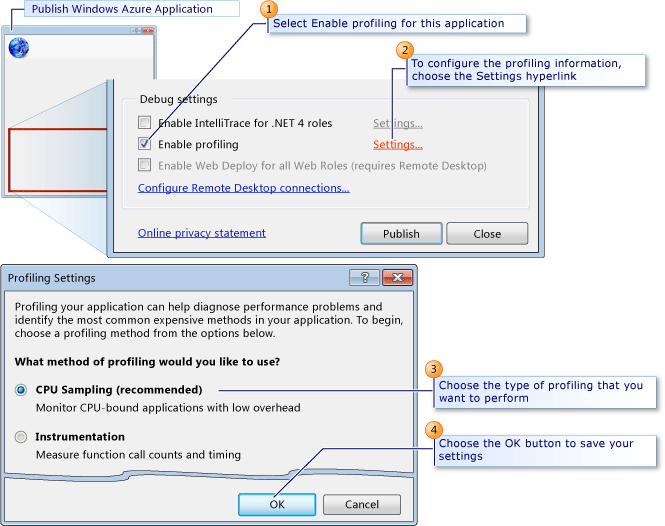
To enable profiling, select the Enable profiling check box.
To configure your profiling settings, choose the Settings hyperlink. The Profiling Settings dialog box appears.
From the What method of profiling would you like to use option buttons, choose the type of profiling that you need.
To collect the tier interaction profiling data, select the Enable Tier Interaction Profiling check box.
To save the settings, choose the OK button.
When you publish this application, these settings are used to create the profiling session for each role.
Viewing Profiling Reports
A profiling session is created for each instance of a role in your cloud service. To view your profiling reports of each session from Visual Studio, you can view the Server Explorer window and then choose the Azure Compute node to select an instance of a role. You can then view the profiling report as shown in the following illustration.
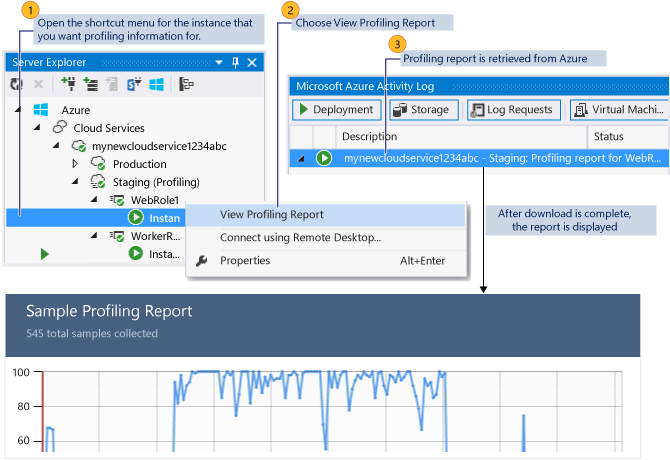
To view profiling reports
- To view the Server Explorer window in Visual Studio, on the menu bar choose View, Server Explorer.
- Choose the Azure Compute node, and then choose the Azure deployment node for the cloud service that you selected to profile when you published from Visual Studio.
- To view profiling reports for an instance, choose the role in the service, open the shortcut menu for a specific instance, and then choose View Profiling Report.
- The report, a .vsp file, is now downloaded from Azure, and the status of the download appears in the Azure Activity Log. When the download completes, the profiling report appears in a tab in the editor for Visual Studio named <Role name><Instance Number><identifier>.vsp. Summary data for the report appears.
- To display different views of the report, in the Current View list, choose the type of view that you want.
This overview explains the basics of profiling. Developers who are new to performance work will see how the Visual Studio Profiling Tools can help them become productive quickly and increase the performance of their code. Developers who are experienced in profiling can gain an overview of specific Profiling Tools features and processes.
Visual Studio provides a variety of profiling tools to help you diagnose different kinds of performance issues depending on your app type.
The profiling tools that you can access during a debugging session are available in the Diagnostic Tools window. The Diagnostic Tools window appears automatically unless you have turned it off. To bring up the window, click Debug / Windows / Show Diagnostic Tools. With the window open, you can select tools for which you want to collect data.

While you are debugging, you can use the Diagnostic Tools window to analyze CPU and memory usage, and you can view events that show performance-related information.
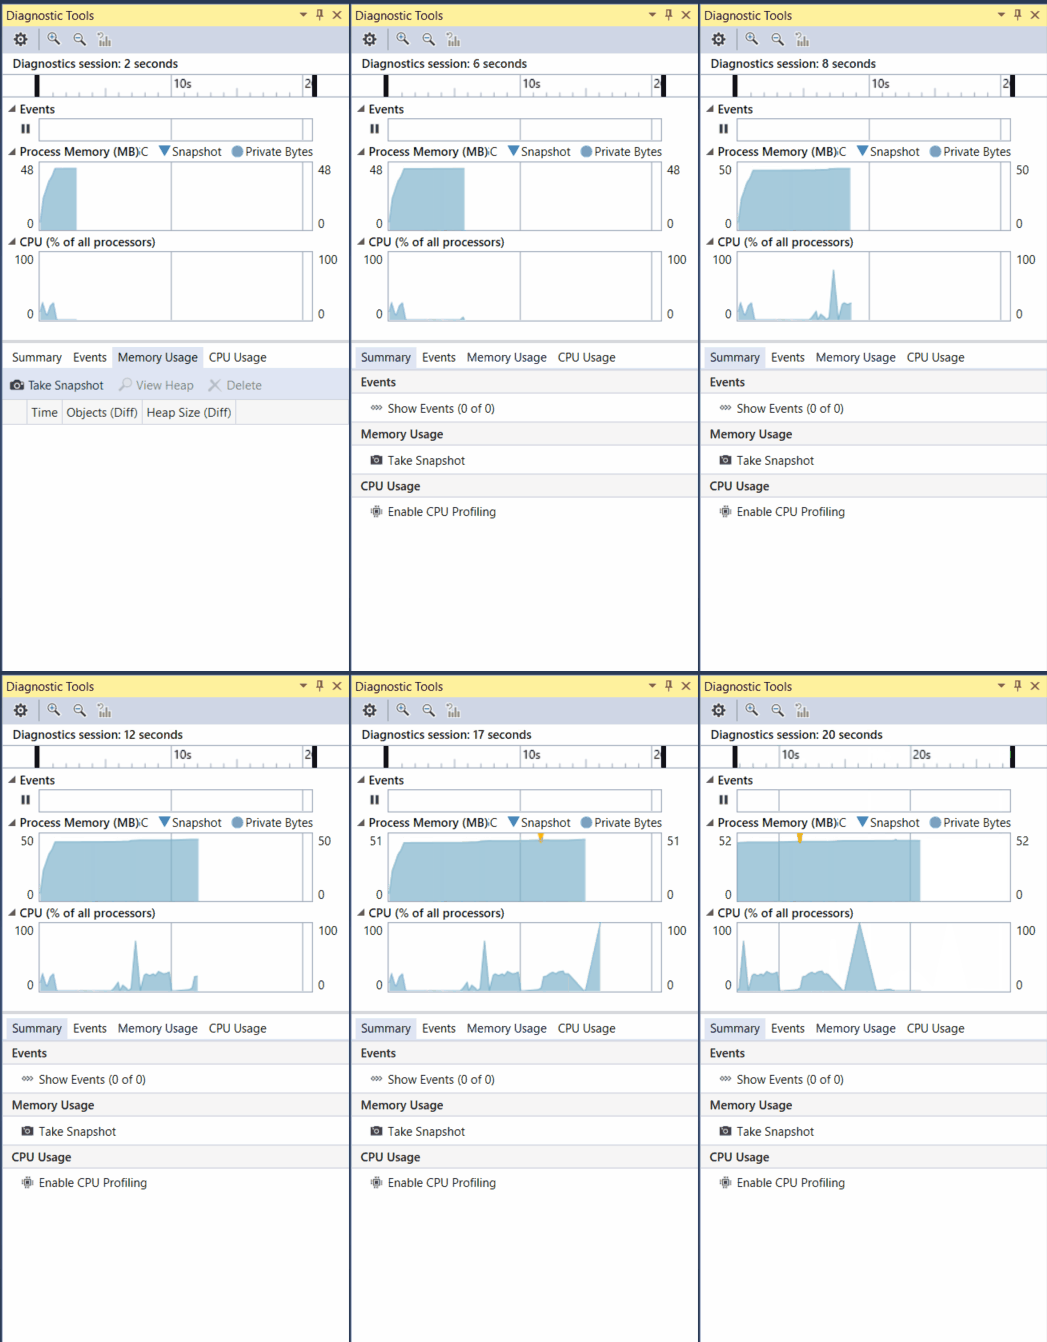
The Diagnostic Tools window is often the preferred way to profile apps, but for Release builds you can also do a post-mortem analysis of your app instead. If you want more information on different approaches, se To see profiling tool support for different app type You can use the post-mortem tools with Windows 7 and later. Windows 8 and later is required to run profiling tools with the debugger (Diagnostic Tools window).
Examine performance using PerfTips
Often, the easiest way to view performance information is to use Using PerfTips, you can view performance information while interacting with your code. You can check information such as the duration of the event (measured from when the debugger was last paused, or when the app started). For example, if you step through code (F10, F11), PerfTips show you the app runtime duration from the previous step operation to the current step.

You can use Perfins to examine how long it takes for a code block to execute, or how long it takes for a single function to complete.
Perfins show the same events that also show up in the Events view of the Diagnostic Tools. In the Events view, you can view different events that occur while you are debugging, such as the setting of a breakpoint or a code stepping operation.
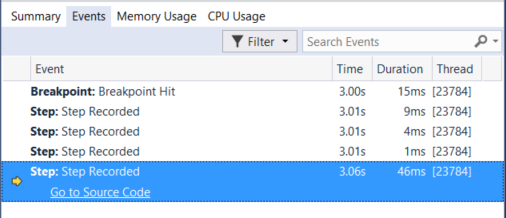
Analyze CPU Usage
The CPU Usage tool is a good place to start analyzing your app’s performance. It will tell you more about CPU resources that your app is consuming. For a more detailed walkthrough of the CPU Usage tool, From the Summary view of the Diagnostic Tools, choose Enable CPU Profiling (you must be in a debugging session).
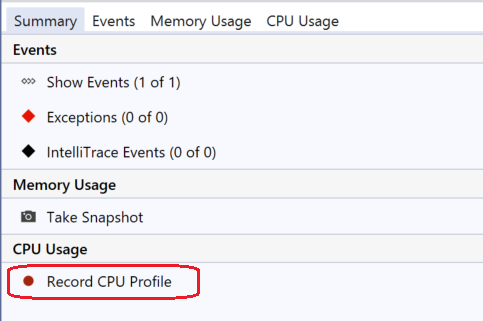
To use the tool most effectively, set two breakpoints in your code, one at the beginning and one at the end of the function or the region of code you want to analyze. Examine the profiling data when you are paused at the second breakpoint.
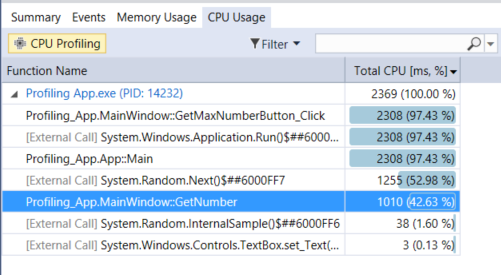
The CPU Usage view shows you a list of functions ordered by longest running, with the longest running function at the top. This can help guide you to functions where performance bottlenecks are happening.
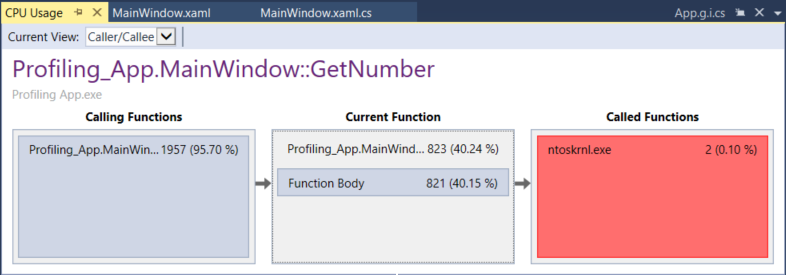
Double-click on a function that you are interested in, and you will see a more detailed three-pane “butterfly” view, with the selected function in the middle of the window, the calling function on the left, and called functions on the right. The Function Body section shows the total amount of time (and the percentage of time) spent in the function body excluding time spent in calling and called functions. This data can help you evaluate whether the function itself is a performance bottleneck.
Analyze memory usage
The Diagnostic Tools window also allows you to evaluate memory usage in your app using the Memory Usage tool. For example, you can look at the number and size of objects on the heap. For more detailed instructions to analyze memory, . Another memory analysis tool, that helps you identify allocation patterns and anomalies in your .NET code.
To analyze memory usage with the debugger-integrated Memory Usage too, you need to take at least one memory snapshot. Often, the best way to analyze memory is to take two snapshots; the first right before a suspected memory issue, and the second snapshot right after a suspected memory issue occurs. Then you can view a diff of the two snapshots and see exactly what changed.
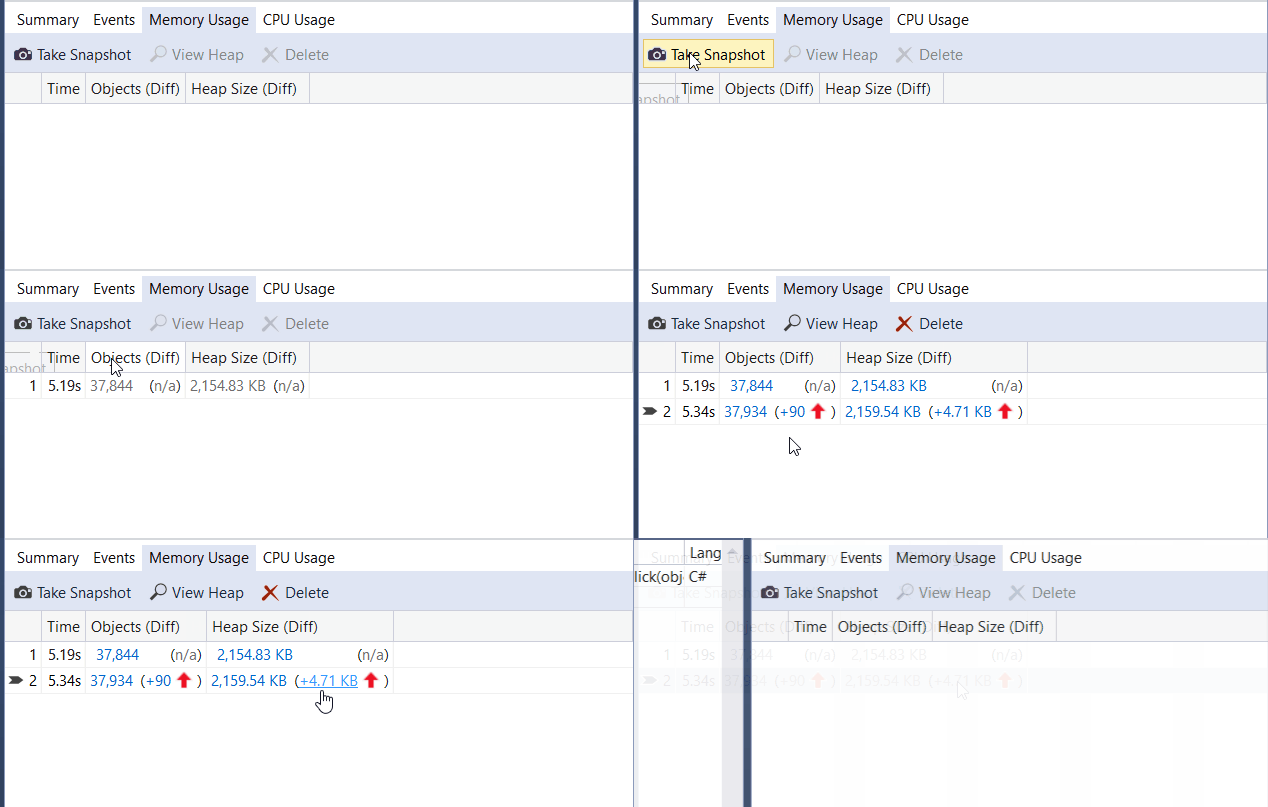
When you select one of the arrow links, you are given a differential view of the heap (a red up arrow shows an increasing object count (left) or an increasing heap size (right)). If you click the right link, you get a differential heap view ordered by objects that increased the most in heap size. This can help you pinpoint memory problems. For example, in the illustration below, the bytes used by ClassHandlersStore objects increased by 3,492 bytes in the second snapshot.
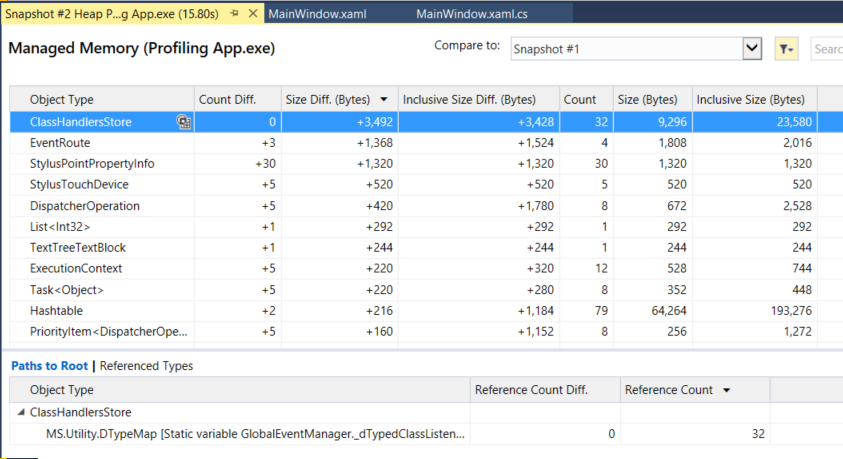
If you click the link on the left instead in the Memory Usage view, the heap view is organized by object count; the objects of a particular type that increased the most in number are shown at the top (sorted by Count Diff column).
Profile release builds without the debugger
Profiling tools like CPU Usage and Memory Usage can be used with the debugger (see earlier sections), or you can run profiling tools post-mortem using the Performance Profiler, which is intended to provide analysis for Release builds. In the Performance Profiler, you can collect diagnostic info while the app is running, and then examine the collected information after the app is stopped. For more information on these different approaches
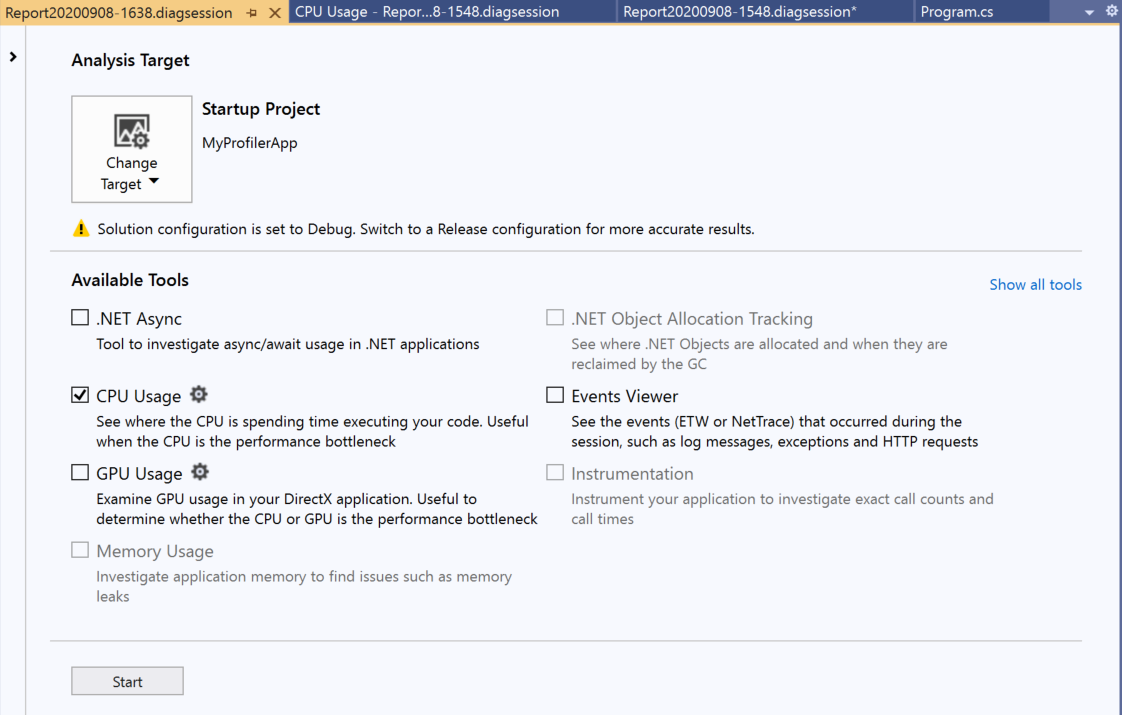
Open the Performance Profiler by choosing Debug > Performance Profiler.
The window will allow you to select multiple profiling tools in some scenarios. Tools such as CPU Usage may provide complementary data that you can use to help in your analysis. You can also use to enable scenarios involving multiple profiling tools.
Examine UI performance and accessibility events (UWP)
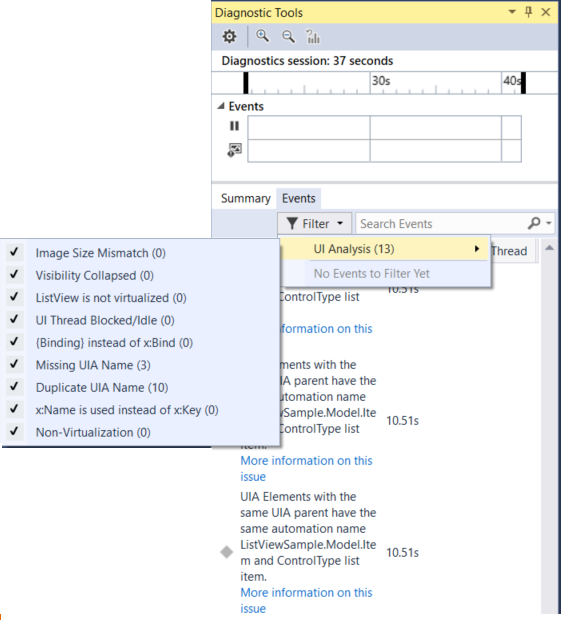
In your UWP apps, you can enable UI Analysis in the Diagnostic Tools window. The tool searches for common performance or accessibility issues and displays them in the Events view while you are debugging. The event descriptions provide information that can help resolve issues.
Analyze resource consumption (XAML)
In XAML apps, such as Windows desktop WPF apps and UWP apps, you can analyze resource consumption using the Application Timeline tool. For example, you can analyze the time spent by your application preparing UI frames (layout and render), servicing network and disk requests, and in scenarios like application startup, page load, and Window resize. To use the tool, choose Application Timeline in the Performance Profiler, and then choose Start. In your app, go through the scenario with a suspected resource consumption issue, and then choose Stop collection to generate the report.
Low framerates in the Visual throughput graph may correspond to visual problems that you see when running your app. Similarly, high numbers in the UI thread utilization graph may also correspond to UI responsiveness issues. In the report, you can select a time period with a suspected performance issue, and then examine the detailed UI thread activities in the Timeline details view (lower pane).

In the Timeline details view, you can find information such as the type of activity (or the UI element involved) along with the duration of the activity. For example, in the illustration, a Layout event for a Grid control takes 57.53 ms.
Analyze GPU Usage (Direct3D)
In Direct3D apps (Direct3D components must be in C++), you can examine activity on the GPU and analyze performance issues. For more information, to use the tool, choose GPU Usage in the Performance Profiler, and then choose Start. In your app, go through the scenario that you’re interested in profiling, and then choose Stop collection to generate a report.
When you select a time period in the graphs and choose view details, a detailed view appears in the lower pane. In the detailed view, you can examine how much activity is happening on each CPU and GPU. Select events in the lowest pane to get popups in the timeline. For example, select the Present event to view Present call popups. (The light gray vertical VSync lines can be used as a reference to understand whether certain Present calls missed Vsync. There must be one Present call between every two Vsyncs in order for the app to steadily hit 60 FPS.)

You can also use the graphs to determine whether there are CPU bound or GPU bound performance bottlenecks.
Analyze performance (legacy tools)
In Visual Studio 2019, the legacy Performance Explorer and related profiling tools such as the Performance Wizard were folded into the Performance Profiler, which you can open using Debug > Performance Profiler. In the Performance Profiler, the available diagnostics tools depend on the target chosen and the current, open startup project. The CPU Usage tool provides the sampling capability previously supported in the Performance Wizard. The Instrumentation tool provides the instrumented profiling capability (for precise call counts and durations) that was in the Performance Wizard. Additional memory tools also appear in the Performance Profiler.

Profiling and diagnostics tools help you diagnose memory and CPU usage and other application-level issues. With these tools, you accumulate data (such as variable values, function calls, and events) over a period such as the time that you run your application. You can view the state of your application at different points during the execution of your code or perform a post-mortem analysis of your application performance.
Create an offline installation of Visual Studio
We designed Visual Studio 2019 to work well in a variety of network and computer configurations. While we recommend that you try the which is a small file and allows you to stay current with all the latest fixes and features—we understand that you might not be able to.
For example, you might have an unreliable internet connection or one that has low bandwidth. If so, you have a few options: You can use the new “Download all, then install” feature to download the files before you install, or you can use the command line to create a local cache of the files.
Installation
Visual Studio provides a command line based stand-alone profiler that can be run without installing the Visual Studio IDE. This situation occurs when a computer does not or cannot have a development environment installed. For example, you should not install a development environment on a production web server.
To install the stand-alone profiler
Download
Locate the stand-alone profile installer (vs_standaloneprofiler.exe) where you downloaded the performance tools and run it.
Add the path for vsinstr.exe to the system path.
At the command prompt, type VSInstr.
Set up symbol server by setting your _NT_SYMBOL_PATH variable to symsrv*symsrv.dll*c:\localcache After you set up your symbol server by using the system environment variables, run the command line profiler tools at a new command prompt. This allows the new environment variables to take effect. In the command prompt window, type the following command:
start %COMSPEC%
Use the tool to serialize your symbols into the profiling data (.vsp) file. Use the VSPerfReport /summary: all /pack symbols switches. If you do not have symbols inserted in your data file, make sure that you have the _NT_SYMBOL_PATH environment variable set.
Installing the prerequisites
Before beginning installation, install the following prerequisites
Make sure you have dotnet framework 4.5 is installed You can download it from the following
If you are on Windows 8.1 or Windows Server 2012 R2, you need to install the update
And once the download is complete, it will appear on the bottom left-hand side as shown below.
- Starting Installation
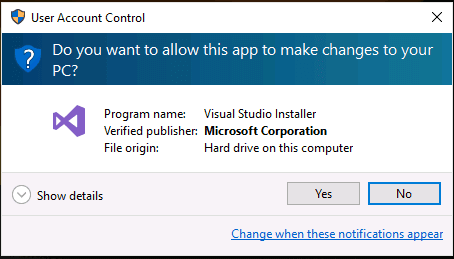
Double-click on the downloaded file to begin the installation

You will be asked for permission to continue. Click on Yes to continue with the installation.
- Software License Terms
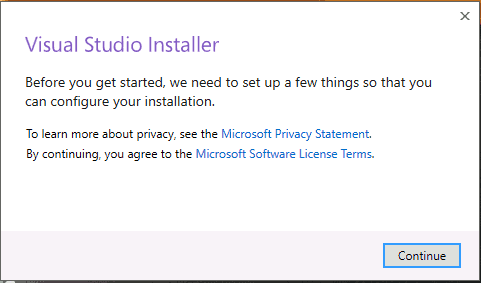
Next, you will be asked to accept the software License terms and Privacy Statement. Click on continue to go ahead with the installation.
- Installer Downloads the required files
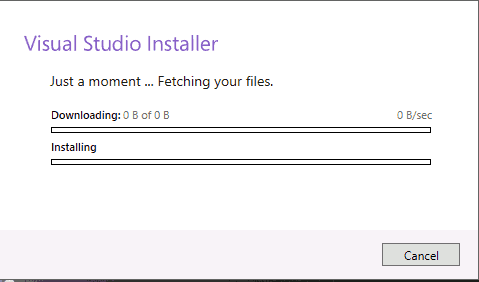
The Installer fetches the required files to install the Visual Studio 2017. This process will take few minutes
- Choosing what to install
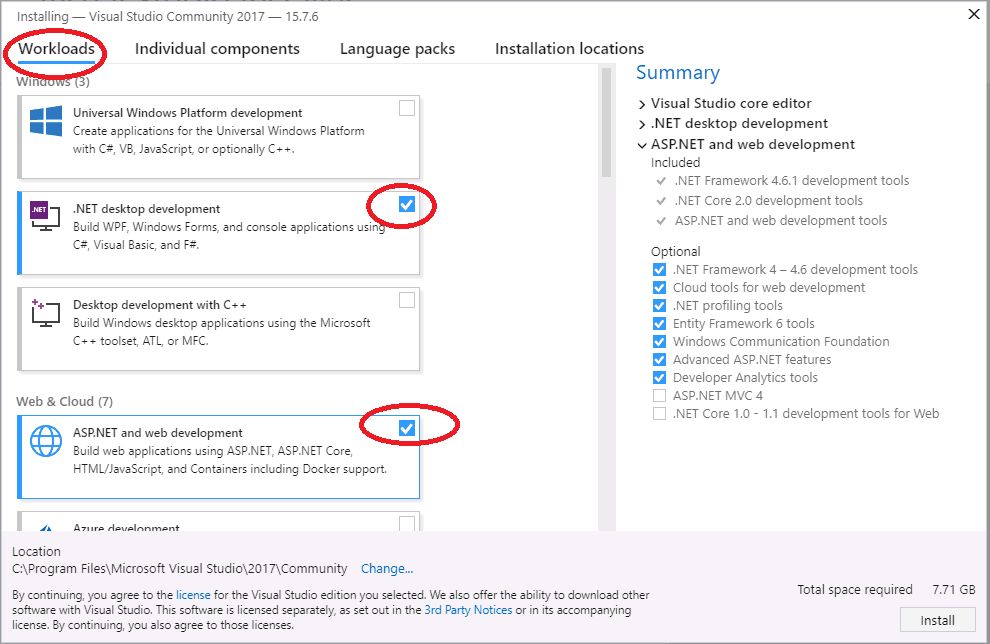
The Installer will ask for the features you wish to install. You have four options here
- Workloads
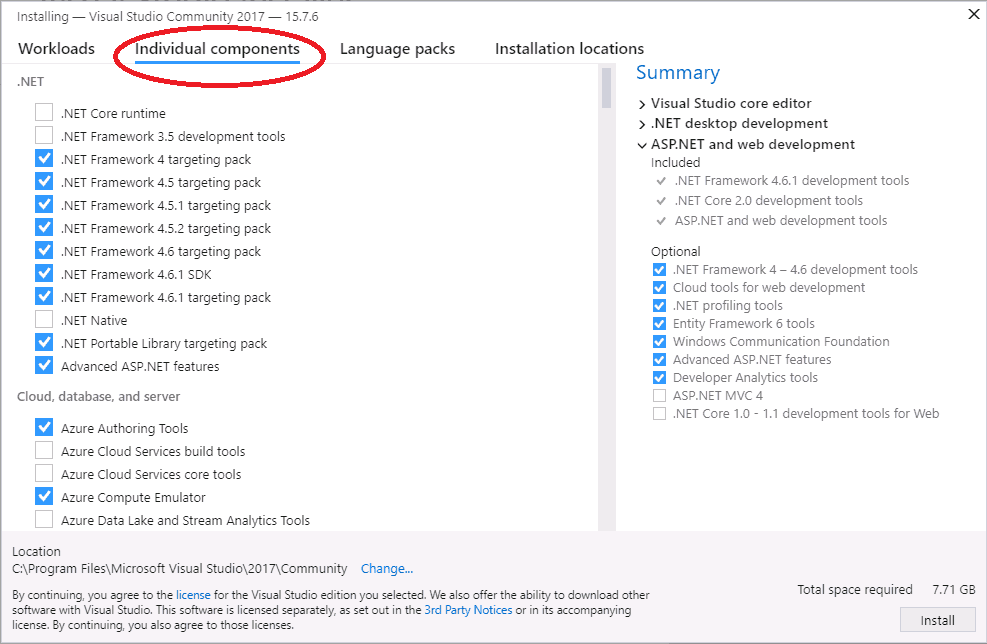
- Individual Components
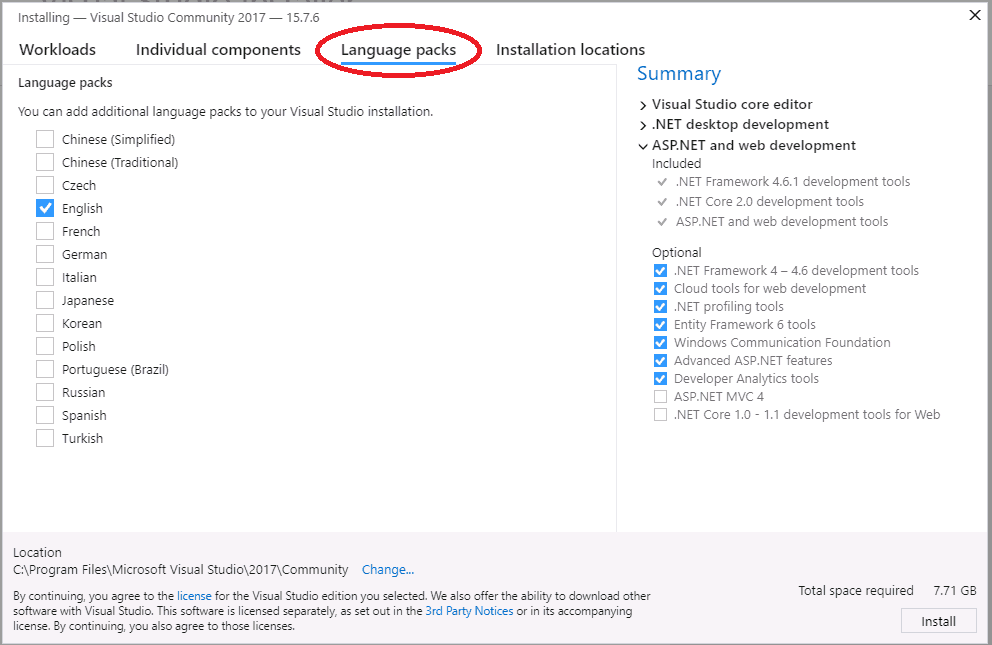
- Language Packs
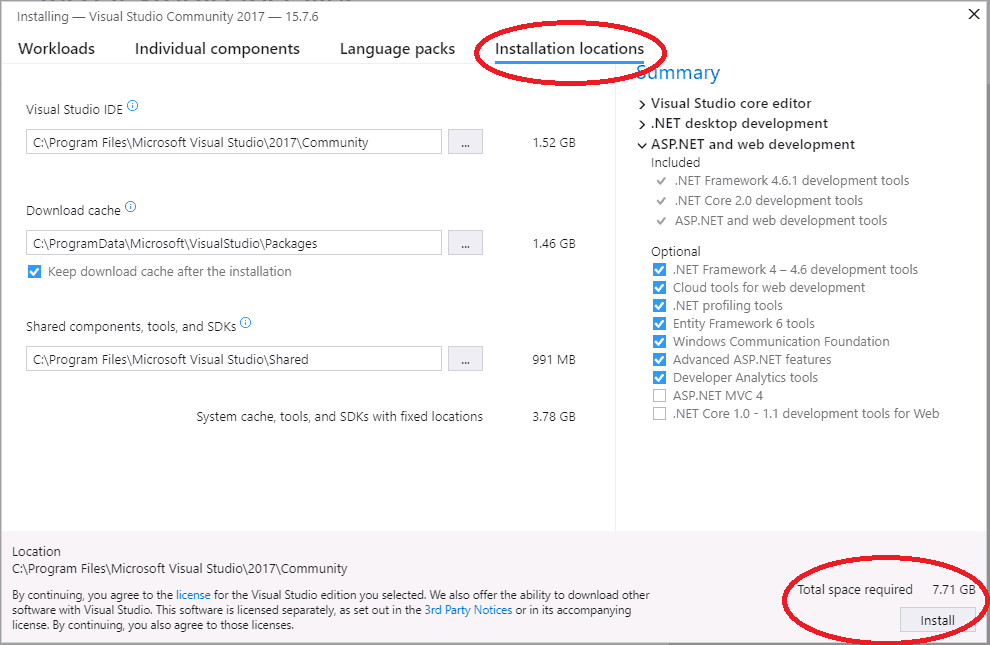
- Installation Location
Select Workloads
The First Option is to select Workloads.
A workload is a group of individual components based on the project type. For Example, if you are developing using ASP.NET for web development then you can choose ASP.NET and web development workload which will install the following components for you
- .Net Framework 4.6
- C# and Visual Basic
- ASP.NET and web development tools
- Entity Framework tools
- Typescript SDK
- IIS Express
- NuGet Package Manager
Select the required Workload. I have chosen .NET Desktop development & ASP.NET and web development.
Select individual components (Optional)
The Second Option gives an exhaustive list of components that you can install. Choosing the workloads automatically selects the components that are part of that workload. You can further customize what you want to install from this option.
Select the required components
Select language packs (Optional)
The language is automatically picked up from the language configured from the operating system. You can change it from this Tab.
Select Installation Location
The Final tab is the installation location. Change the location if you wish to
- Installing
Now, click on the Install button to begin installation of Visual Studio 2017.
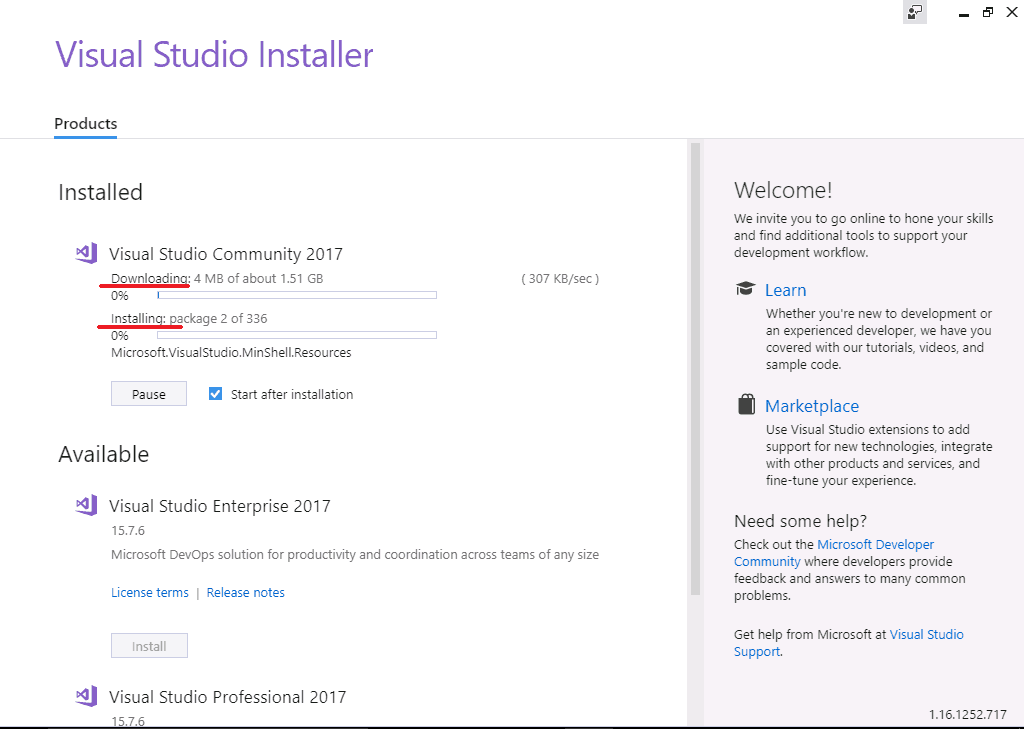
The installer will now download each component from the internet and starts the installation. This will take a while depending on your internet speed.
Once the installation is complete, you will be presented with the Installation succeeded message along with the option to register
Registration
Next, Sign in window appears, you can Sign in or click on Sign up to create a new account. In case if you wish to continue without Signing in click on “Not now, maybe later” and proceed. You can sign in later from the option Help -> Register Product.
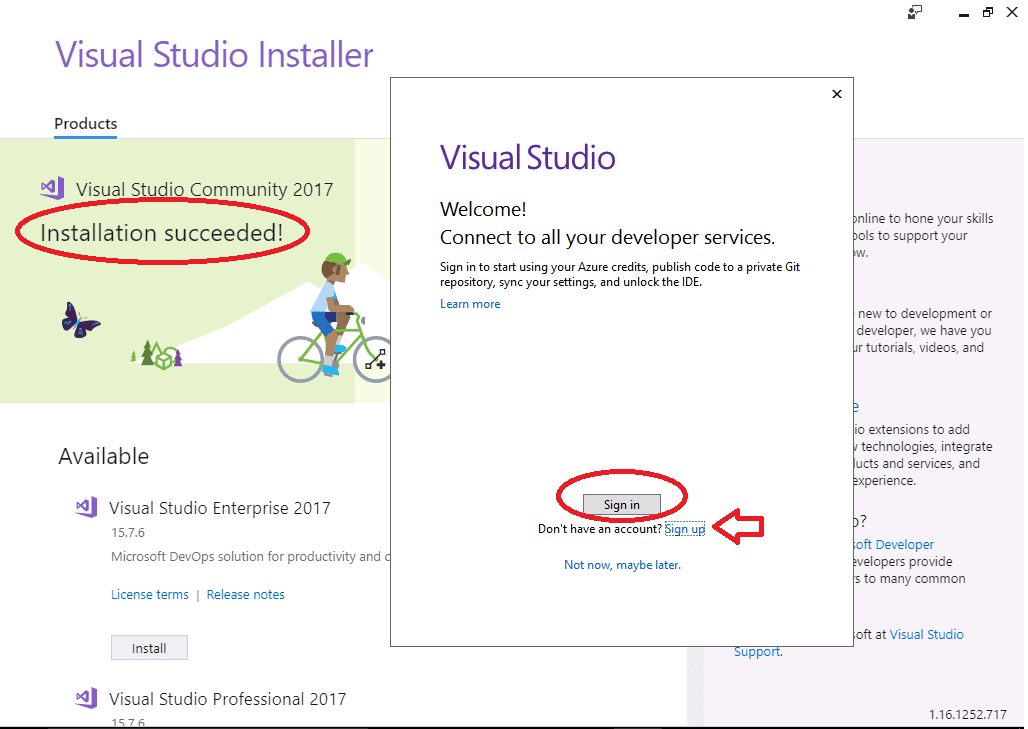
Setup the initial environment
Next, the following screen appears, where you are requested to enter the Development Settings & You can sign in later from the option Help -> Register Product. Select accordingly.
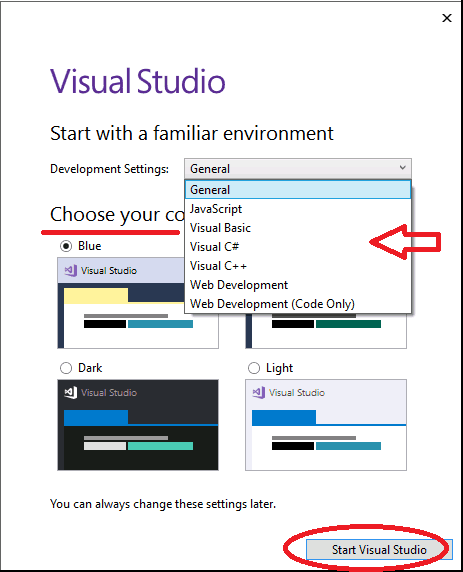
Click on Start Visual Studio and start working on Visual Studio 20017.
The Visual Studio Profiling Tools help you identify performance issues in source code and compare the performance of possible solutions. Profiling Tools wizards and default settings can give you immediate insight into many performance issues. The features and options of the Profiling Tools provide exact control over the profiling process. This control includes the precise targeting of code sections, the collection of block-level timing information, and the inclusion of additional processor and system performance data in your data.
The following steps make up the basic process of using the Profiling Tools:
- Configure the performance session by specifying the collection method and the data that you want to collect.
- Collect profiling data by running the application in the performance session.
- Analyze the data to identify the performance issue.
- Modify code in the Visual Studio integrated development environment (IDE) to increases the application performance of the code
- Collect profiling data on the changed code, and compare the profiling data of the original and changed data.
- Generate a report that documents the increase in performance.
To work with the information that is provided by profiling, you should have symbol information available for the binaries that you want to profile and for the binaries of the Windows operating system.
Videos
Profiling Performance in Visual Studio 2010 (VS2010 Quick Hits)

