1-click AWS Deployment 1-click Azure Deployment
Overview
Real-time SQL BI Performance Monitoring
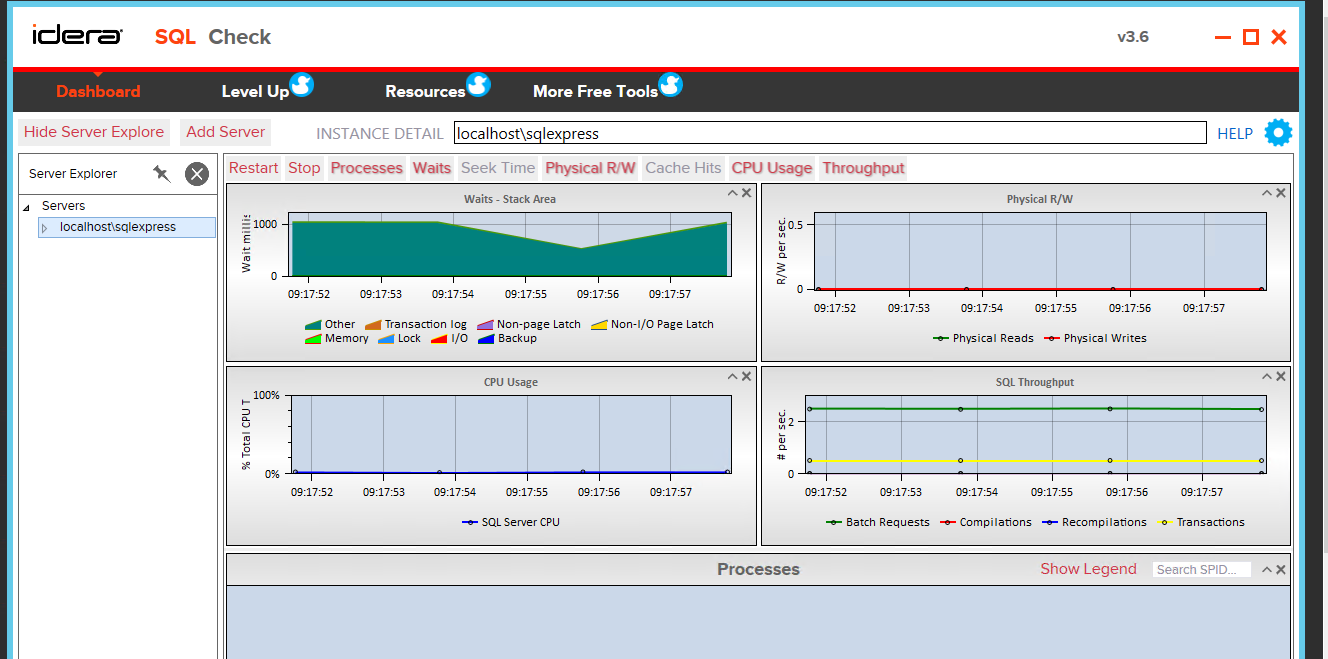
Monitor the performance of physical server activity as well as analysis services to get a better picture of your SQL BI systems. Set the refresh rate to as little as 1 minute and see up to 2 ½ hours of data. The configurable dashboard provides an at-a-glance view of the metrics that are important to you.
Physical Server Metrics
View CPU utilization in terms of percentage as well as query pool and processing pool queue lengths. See storage engine activity and cache performance. The sessions bubble chart displays all active sessions visually by CPU time with bubble size and color distinctions to show the most CPU intensive sessions. Hover over a bubble to see a snapshot of session and utilization details.
Analysis Services Metrics
Monitor SSAS processing by rows read and rows written to see the analysis services load. View memory in SSAS specific shrinkable and non-shrinkable categories to get a precise view of the SSAS memory utilization of the overall system memory. See the SSAS cache activity to see how efficiently the cache memory is being used.
Up and Running in Minutes with No Agents
The small download and easy installation wizard will get you up and running quickly. No agents are installed on the server as all metrics are obtained through SQL or WMI.
Integrate with SSMS
Designed to launch directly within SQL Server Management Studio (SQL 2012 and above) for optimal usability and efficient workflow.
SQL Check on cloud For AWS

Features
Major Features of SQL Check
- Monitor 20 key performance metrics
- See throughput of varying types
- See “heartbeat” statistics at different intervals
- Up and running in minutes with easy installation wizard
- No agents required
AWS
Installation Instructions For Windows
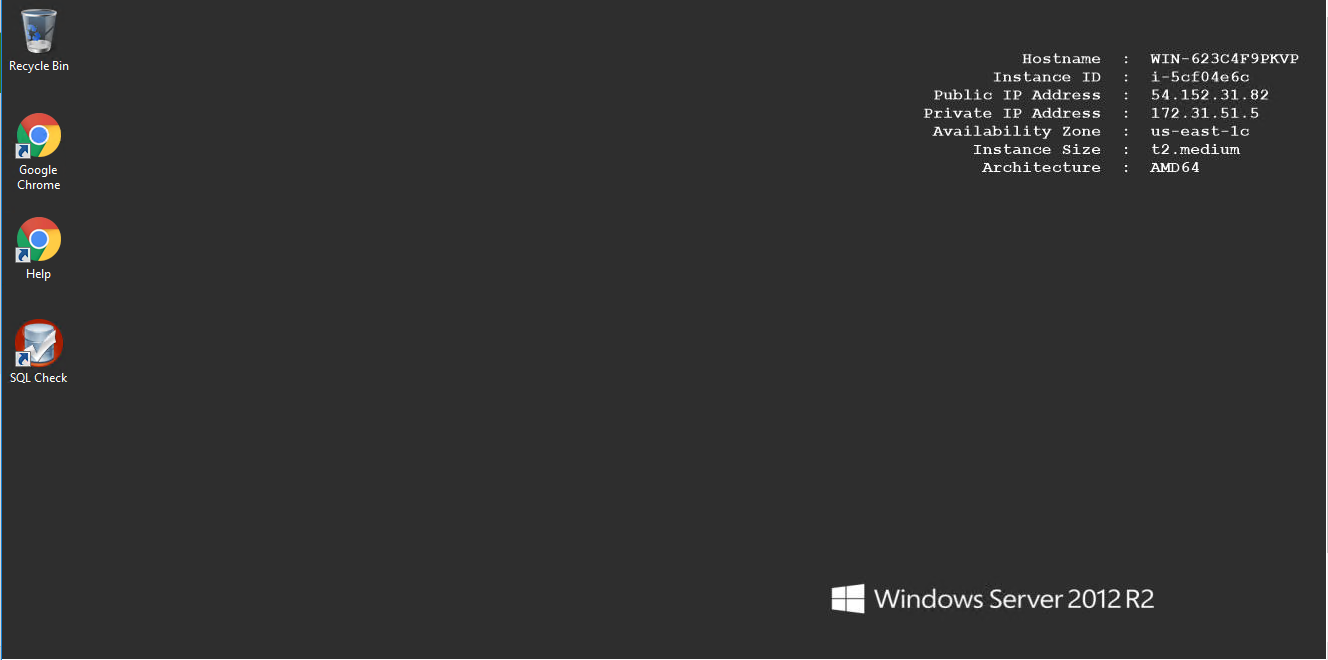
A) Click the Windows “Start” button and select “All Programs” and then point to SQL Check.
B) RDP Connection: To connect to the operating system,
1) Connect to virtual machine using following RDP credentials :
- Hostname: PublicDNS / IP of machine
- Port : 3389
Username: To connect to the operating system, use RDP and the username is Administrator.
Password : Please Click here to know how to get password .
C) Other Information:
1.Default installation path: will be on your root folder “C:\Program Files\Idera\SQL Check\”
2.Default ports:
- Windows Machines: RDP Port – 3389
- Http: 80
- Https: 443
Configure custom inbound and outbound rules using this link
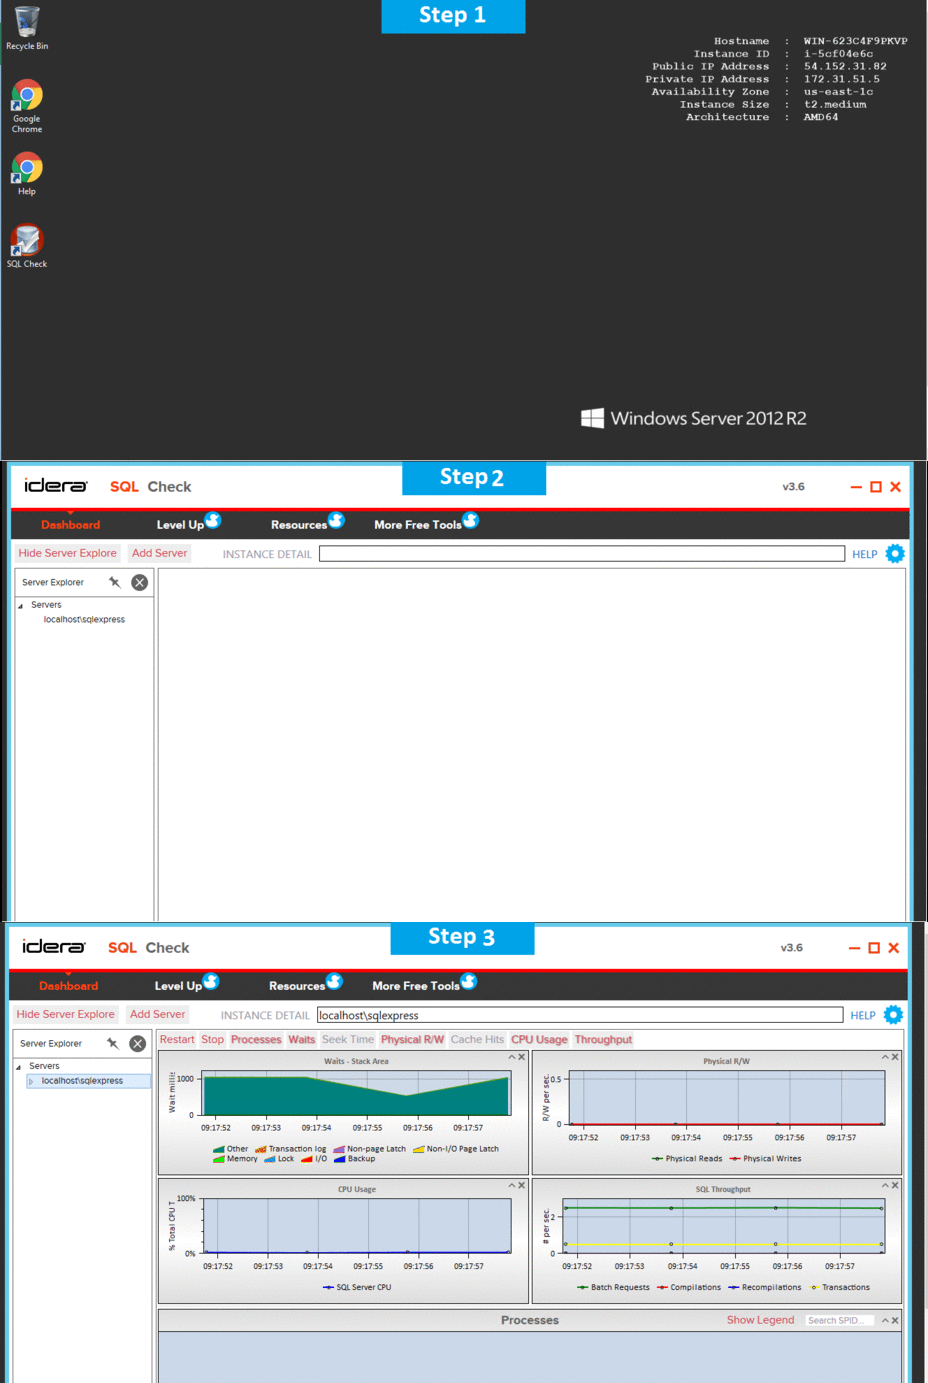
Installation Step by Step Screenshots


