

Overview
Code Blocks is a free C, C++ and Fortran IDE built to encounter the maximum challenging requirements of its users. It is designed to be very extensible and fully configurable. Code::Blocks is the most demanding needs of its users. It is designed to be very extensible and fully configurable. Finally, an IDE with all the features you need, having a consistent look, feel and operation across platforms. Built around a plugin framework, Code: Blocks can be extended with plugins. Any kind of functionality can be added by installing/coding a plugin. For example, compiling and debugging functionality is already provided by plugins.
How to use Code Blocks
An inventers imagination is only restricted by his tools, here we will learn about the different tools and hot keys available in Code Blocks that can be used to assist and streamline our programming approach. However if you know how to use Code Blocks and all its tools, it can make the process of coding a bit less unapproachable. And that is something every beginner can use.
So this is the first screen that you are going to see when you start Code Blocks. If you see some extra tabs or toolbars, just ignore them, we will get to their usage a couple of steps down this post. The tab marked ‘Start Here’ is where we will be writing all our code. It’s called the Editor. You can also see some shortcuts. Create a project or Open an existing project. In the first post where we learned how to execute our first C program in Code blocks, we had created a new project and proceeded from there. You don’t always have to do that.
We need to understand how to manage our code. In the beginning, it’s going to be very simple. A single file of code, execution, debugging and that will be it. But as you progress through this course and the complexity of your projects increase, you will notice that you will be solving problems using multiple files and maybe even custom libraries. In short, file management is a skill that you should know first and foremost.
See that drop-down menu titled ‘View’ in the top-right region of the window. Select the ‘Manager’ option from it.
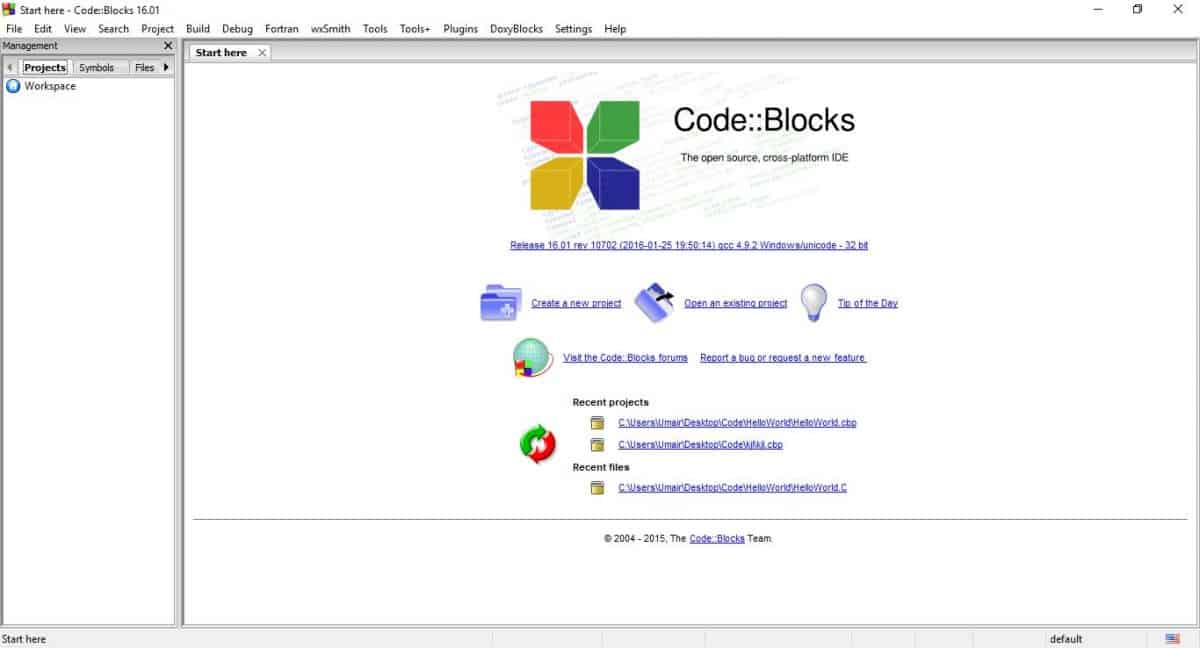
The Workspace is self-explanatory. It’s a collection of all the different projects and their files that are currently open in code blocks. Now go back to the same drop-down menu View > Toolbars > Main. The following toolbar should prop up right below the drop-down menus.
![]()
Using the Management window and the Main toolbar we will control our code files.
A new project is the mother load of any problem set that you are working on. All the code files (known as Sources), ASM files (similar to Sources, but in Assembly level language), header files (like stdio.h) and pretty much everything else is stored in the Project. All projects have an extension of .cbp.You can also add multiple files to the same folder and create your own libraries ( a handy way to speed up your workflow on large codes). Interestingly, you can also change the compiler for a particular file within the project. Basically, you can control the entire project’s settings from the Management tab.
Suppose you wrote a few lines of code in a class and you wish to perform a quick and simple check on that code. Creating a new project can be a hassle in this case. Just click the new file icon on the Main toolbar and select the highlighted option.
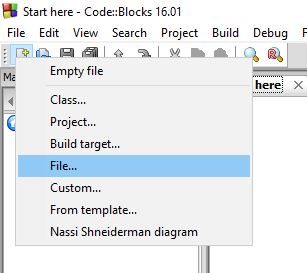
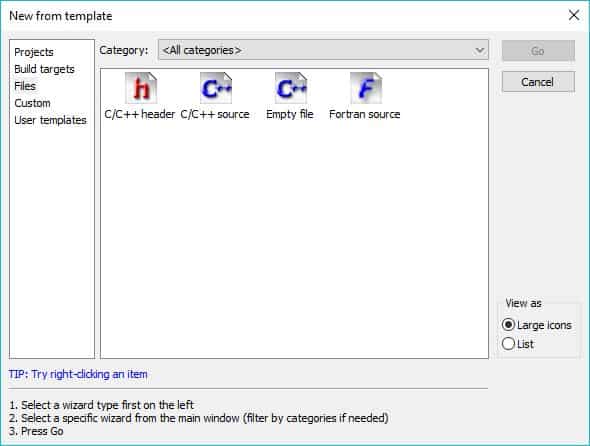
Select C/C++ source.
Give your file a valid path and start coding. Note that using a file without creating a project first, though simpler to check small snippets of code, won’t allow you access to the debugger tool for that particular file.
How to write code?
We’ve seen how to type in the code in the Editor window in the last post. Let’s add to that to make writing the code a bit easier for you.If you are someone migrating from a DOS based IDE like Turbo C++, you will need to change a few things that will not work in code blocks. For example, you’ll need to swap out void main() with int main(). We will highlight these differences as we begin coding.
How to add a C/C++ custom help file to code blocks?
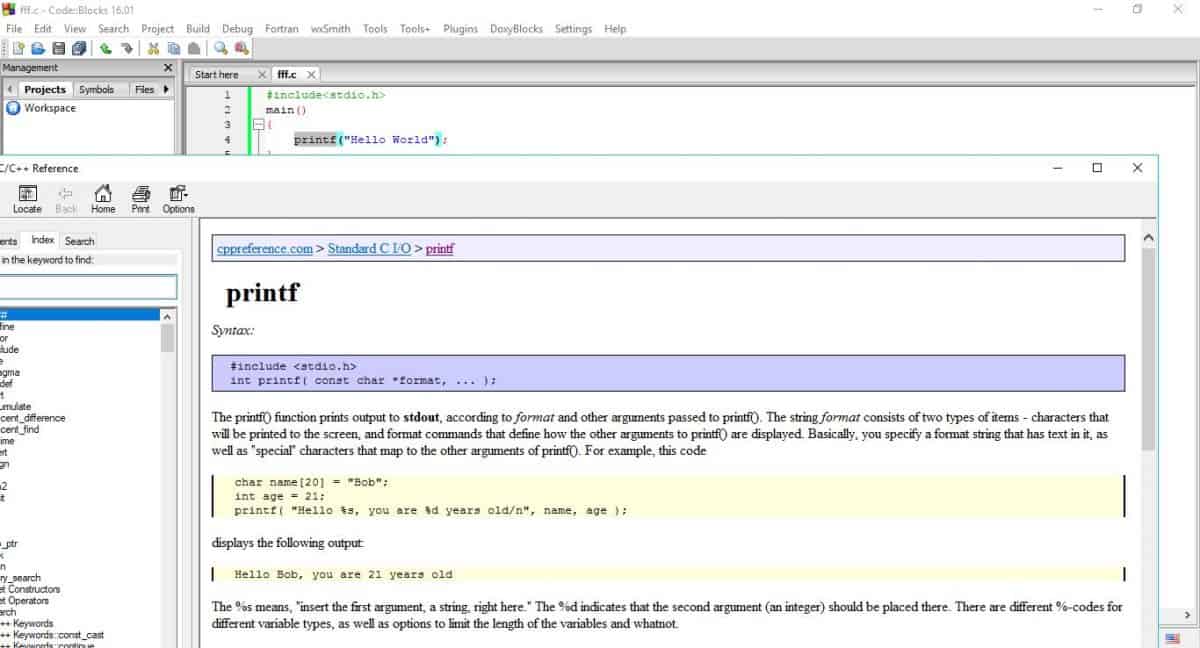
Imagine this scenario. There’s a C problem that you’re having trouble with. So you wander into the realm of online help and ask around for help. If you’re lucky enough, some kind bloke might give you a code snippet to try. You bring that code into Code Blocks, build it and it works! But now you have to understand the stranger’s code. There’s an instruction you don’t quite understand. Instead of googling it, you can just check everything about that instruction within Code Blocks!For this, we need to add a custom help file to Code Blocks. Let’s do that.
Download the CPP CHM file from here. Head on to Settings>Environment>Help Files.
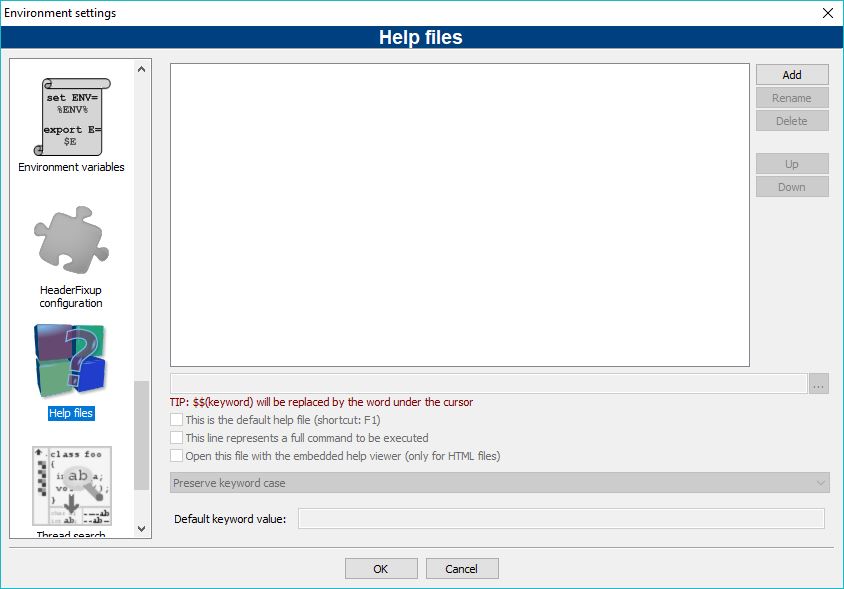
Click on add and give it a name. Let’s call it cpp. Locate the file in your downloads folder and add it to the IDE. Don’t forget to check the box that makes it the default help file. You can now just highlight the instruction you want to know the meaning of and press F1.
Tools for good coding practices
A good piece of code always compiles with no errors or warnings. Code blocks, by default, has a low threshold to check for warnings. But you can and should increase this threshold so that your code efficiency and quality increases. Here’s how you can do it.
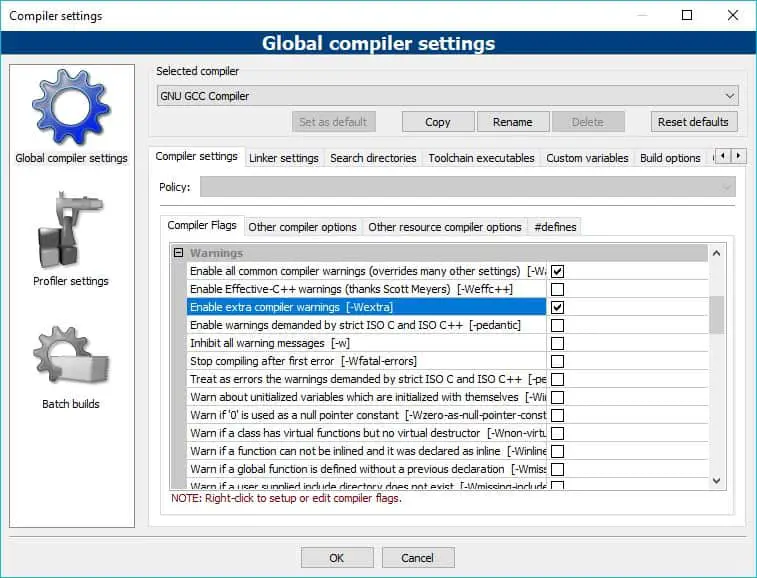
Navigate to Settings>Compiler. And check the two boxes as shown above.
On the same premise, code blocks also offer a certain level of code-refactoring. Code refactoring is a method where you can clean out and structure your code by removing or modifying the code. You can shift around snippets, rename stuff, change different levels etc. You can do all of that without changing the behavior of the code. So the end result is a leaner, well-structured code that performs the same way it did before code refactoring. You won’t need this initially, but you should remember it because we will be using Code Blocks’ (limited) code-refactoring features.
Compiling your code
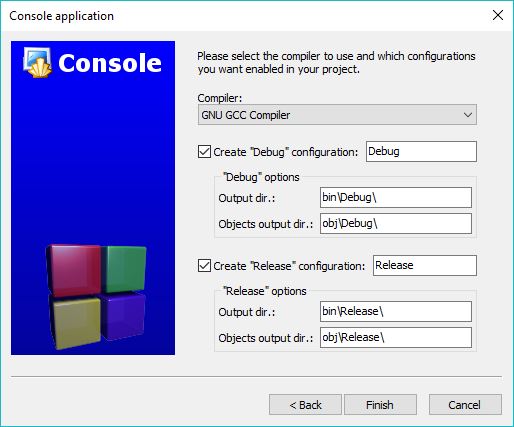
When you first start a new project, you will notice the window shown below. Make sure you’ve selected the Debug and Release options. These two options will build files that will allow you to debug your code and execute it.
So once you’ve written your program, you need to compile it. As seen in our previous posts, we will be using the GCC compiler for this. The compiler converts our code into machine code that is understandable by the computer.From the ‘View’ drop-down menu, navigate to toolbars and select the Compiler toolbar.
![]()
The first icon, the yellow gear, is used to Build the project. This entails compiling the code, checking for logical or syntax errors, building the executable file, debug file and release file. Assuming there is no error in your code, you can now click the Run tool to execute the code. The third icon combines the Build and Run options.However, if you have errors in your code, it won’t compile. Go to the View drop-down menu again and select the option titled Logs. A new window should now be visible at the bottom of your screen. Within this window, you can see a tab titled Build messages. This tab keeps a log of your code compilation errors and warnings with the exact location of the error.
Debugging Tools
When you execute a code, the final output that you get is the one you choose to be displayed. Suppose you are writing a program to add a = 2, b =3 and then multiply the result with c = 8 and display the final answer. What you will see on-screen is the final answer, i.e 40. What if you want to find the value at step 2 though, what if you wish to find the value of the Sum of 2 and 3? Yes, you can print it too. But this was a simple example, now blow this up into some code where you have hundreds of variables and different functions. It will be very time consuming to print the value of every variable at every step.The Debug tool can do that for you. Essentially, it gives you an idea of how your program is performing. So that you can check for errors and then correct them.Generally here’s how it works. You write the code, set breakpoints (the debugger will execute the code only till it reaches the breakpoint, and then select a list of variables that you wish to keep a track off. Then you debug the code. And you can check the values of the variables you had selected to watch.
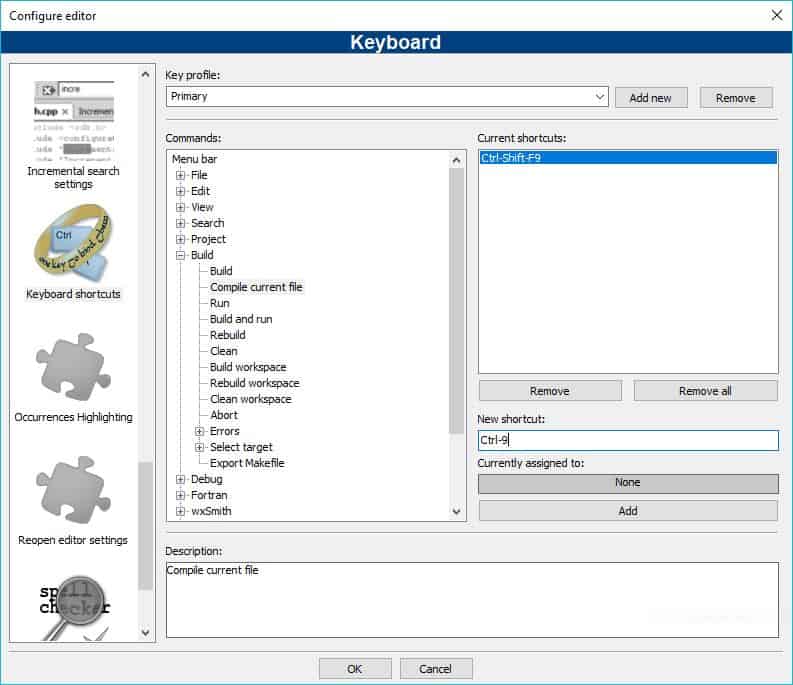
Keyboard Shortcuts
Imagine Mark Zuckerberg fumbling for the mouse every few seconds in the incredibly intense hacking scene in the movie Social Network. It probably wouldn’t have looked as cool as it did. That’s kind of true! When you have an idea to a problem and you are coding, using the mouse kind of breaks your momentum. So enter Code Blocks feature of customizable keyboard shortcuts or hotkeys. I won’t post a list to these shortcuts as you can totally modify them. Here’s how you can do that.Under the Settings drop-down, select Editor. This window shall pop-up on your screen. From the pane on the left, scroll down to Keyboard Shortcuts. There will be a comprehensive list on the right of all the actions that can be performed using keyboard shortcuts. Click on any of them, make a note of the shortcut or customize it according to your preferences.
When you exit Code Blocks, you will be asked if you’d like to save the Workspace and the Layout. The Layout is the placement of various windows that you may have positioned. And the Workspace refers to the projects you are working on. Saving your Workspace will open your files in the Workspace section the way you leave them. Similarly saving your Layout will retain the arrangement of Windows that you had done last.
All the instructions for using Code Blocks competently described above should serve to get you aware of the IDE and run different projects properly.
—
Code::Blocks is an IDE packed full of all the features you will need. It has a consistent look, feel and operation across its supported platforms.
CodeBlocks is owned by CodeBlocks(www.codeblocks.org) and they own all related trademarks and IP rights for this software.
It has been built around a plugin framework, therefore Code::Blocks can be extended with plugins. Support for any kind of functionality can be added by installing/coding a plugin.
Code-Blocks on cloud for AWS
Features
Highlights:
- Open Source! GPLv3, no hidden costs.
- Cross-platform. Runs on Linux, Mac, Windows (uses wxWidgets).
- Written in C++. No interpreted languages or proprietary libs needed.
- Extensible through plugins
Compiler:
- Multiple compiler support:
- GCC (MingW / GNU GCC)
- MSVC++
- clang
- Digital Mars
- Borland C++ 5.5
- Open Watcom
- …and more
- Very fast custom build system (no makefiles needed)
- Support for parallel builds (utilizing your CPU’s extra cores)
- Multi-target projects
- Workspaces to combine multiple projects
- Inter-project dependencies inside workspace
- Imports MSVC projects and workspaces (NOTE: assembly code not supported yet)
- Imports Dev-C++ projects.
Debugger:
- Interfaces GNU GDB
- Also supports MS CDB (not fully featured)
- Full breakpoints support:
- Code breakpoints
- Data breakpoints (read, write and read/write)
- Breakpoint conditions (break only when an expression is true)
- Breakpoint ignore counts (break only after certain number of hits)
- Display local function symbols and arguments
- User-defined watches (support for watching user-defined types through scripting)
- Call stack
- Disassembly
- Custom memory dump
- Switch between threads
- View CPU registers
Interface:
- Syntax highlighting, customizable and extensible
- Code folding for C, C++, Fortran, XML and many more files.
- Tabbed interface
- Code completion
- Class Browser
- Smart indent
- One-key swap between .h and .c/.cpp files
- Open files list for quick switching between files (optional)
- External customizable “Tools”
- To-do list management with different users
Major Features of Code::Blocks
- Written in C++. No interpreted languages or proprietary libs needed..
- Full plugin support.
- Multiple compiler support: GCC (MingW / GNU GCC), MSVC++, clang, Digital Mars, Borland C++ 5.5, and Open Watcom etc.
- Support for parallel builds.
- Imports Dev-C++ projects.
- Debugger with full breakpoints support.
- Cross-platform.
AWS
Installation Instructions For Windows
Note: How to find PublicDNS in AWS
Step 1) RDP Connection: To connect to the deployed instance, Please follow Instructions to Connect to Windows instance on AWS Cloud
1) Connect to the virtual machine using following RDP credentials:
- Hostname: PublicDNS / IP of machine
- Port : 3389
Username: To connect to the operating system, use RDP and the username is Administrator.
Password: Please Click here to know how to get password .
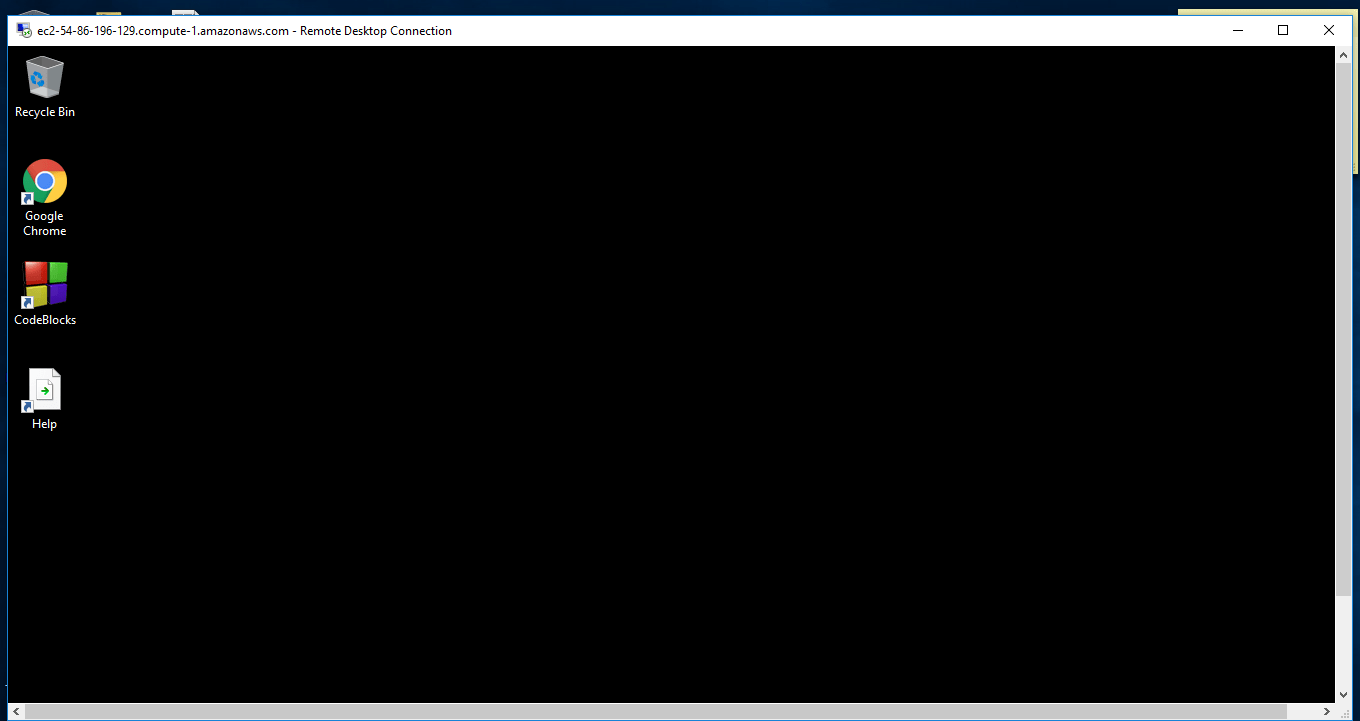
Step 2) Click the Windows “Start” button and select “All Programs” and then point to CodeBlocks
Step 3) Other Information:
1.Default installation path: will be in your root folder “C:\Program Files (x86)\CodeBlocks”
2.Default ports:
- Windows Machines: RDP Port – 3389
- Http: 80
- Https: 443
Configure custom inbound and outbound rules using this link
Users Instructions Screenshots
Videos
External embedded media removed for production hardening.
