
1-click AWS Deployment 1-click Azure Deployment
Overview
Every modern web browser includes a powerful suite of developer tools. These tools do a range of things, from inspecting currently-loaded HTML, CSS and JavaScript to showing which assets the page has requested and how long they took to load.The browser developer tools, or just “dev tools” in short, are possibly the biggest boon to any front-end developer, either beginner, or an expert.But surprisingly, they are not used to their full potential. A lot of developers are still unaware of the full power of the dev tools.
Here we will explain how to use the basic functions of your browser’s devtools.
How to open the devtools in your browser
The devtools live inside your browser in a subwindow that looks roughly like this, depending on what browser you are using:
How do you pull it up? Three ways:
Keyboard: Ctrl + Shift + I, except
Internet Explorer and Edge: F12
macOS: ⌘ + ⌥ + I
Menu bar:
Firefox: Menu ➤ Web Developer ➤ Toggle Tools, or Tools ➤ Web Developer ➤ Toggle Tools
Chrome: More tools ➤ Developer tools
Safari: Develop ➤ Show Web Inspector. If you can’t see the Develop menu, go to Safari ➤ Preferences ➤ Advanced, and check the Show Develop menu in menu bar checkbox.
Opera: Developer ➤ Developer tools
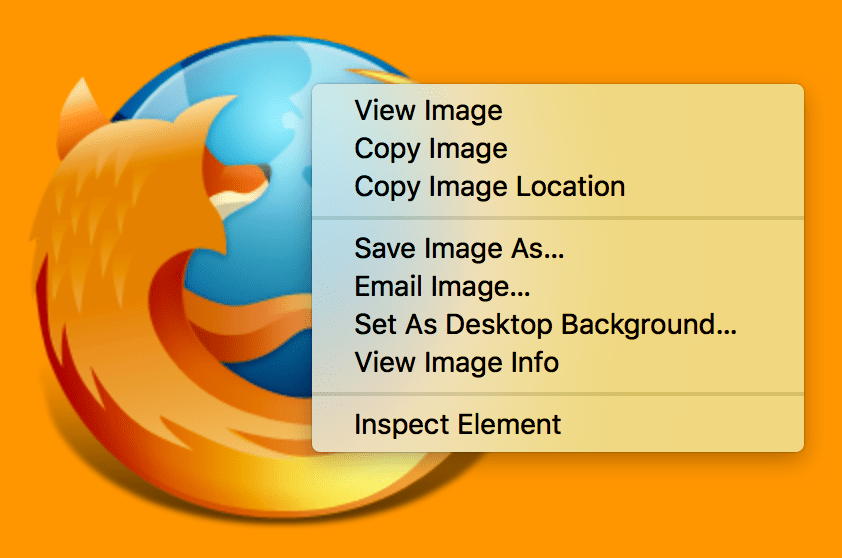
Context menu: Press-and-hold/right-click an item on a webpage (Ctrl-click on the Mac), and choose Inspect Element from the context menu that appears. (An added bonus: this method straight-away highlights the code of the element you right-clicked.)
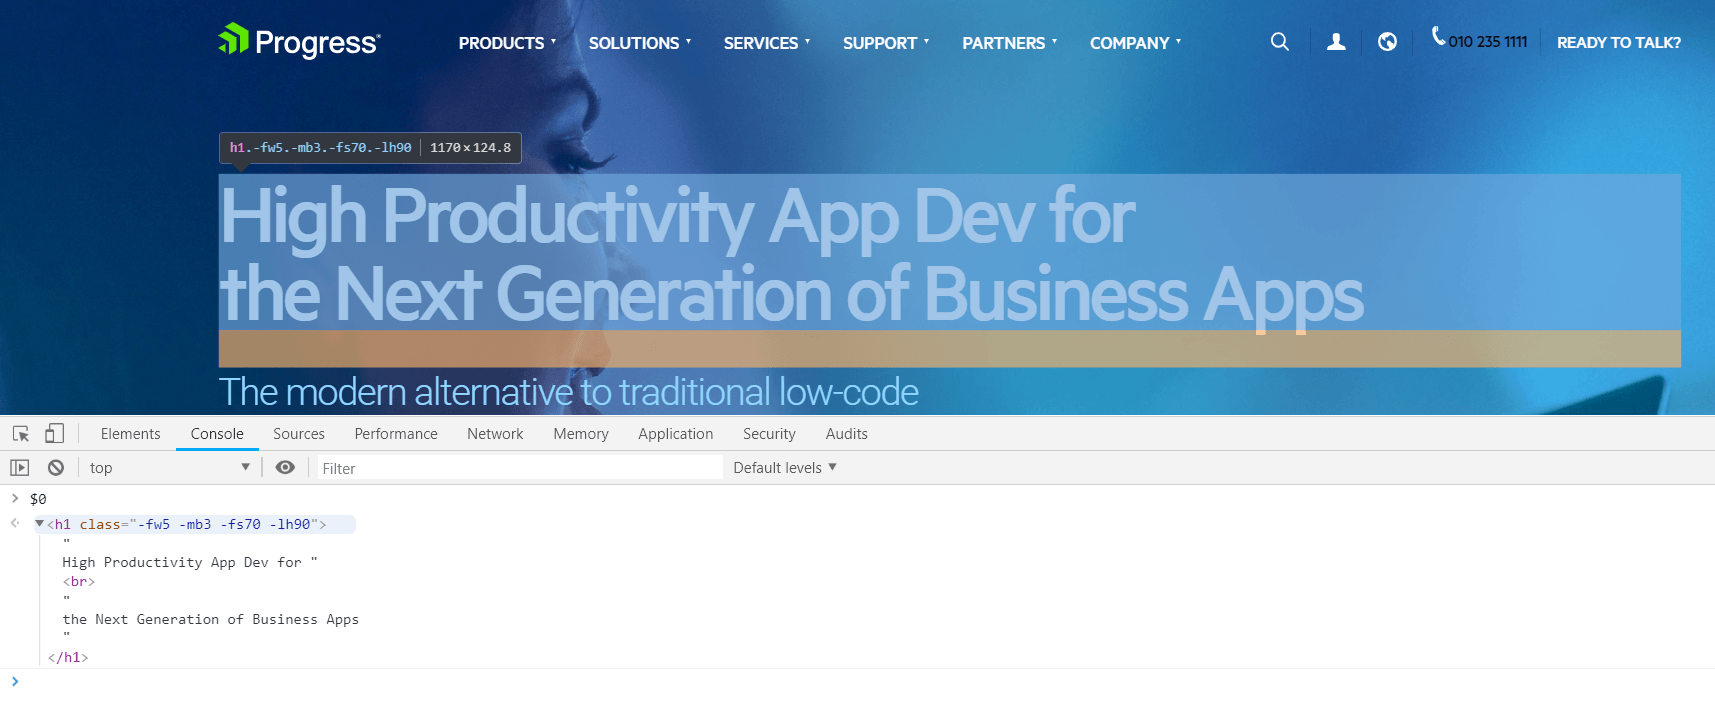
The Inspector: DOM explorer and CSS editor
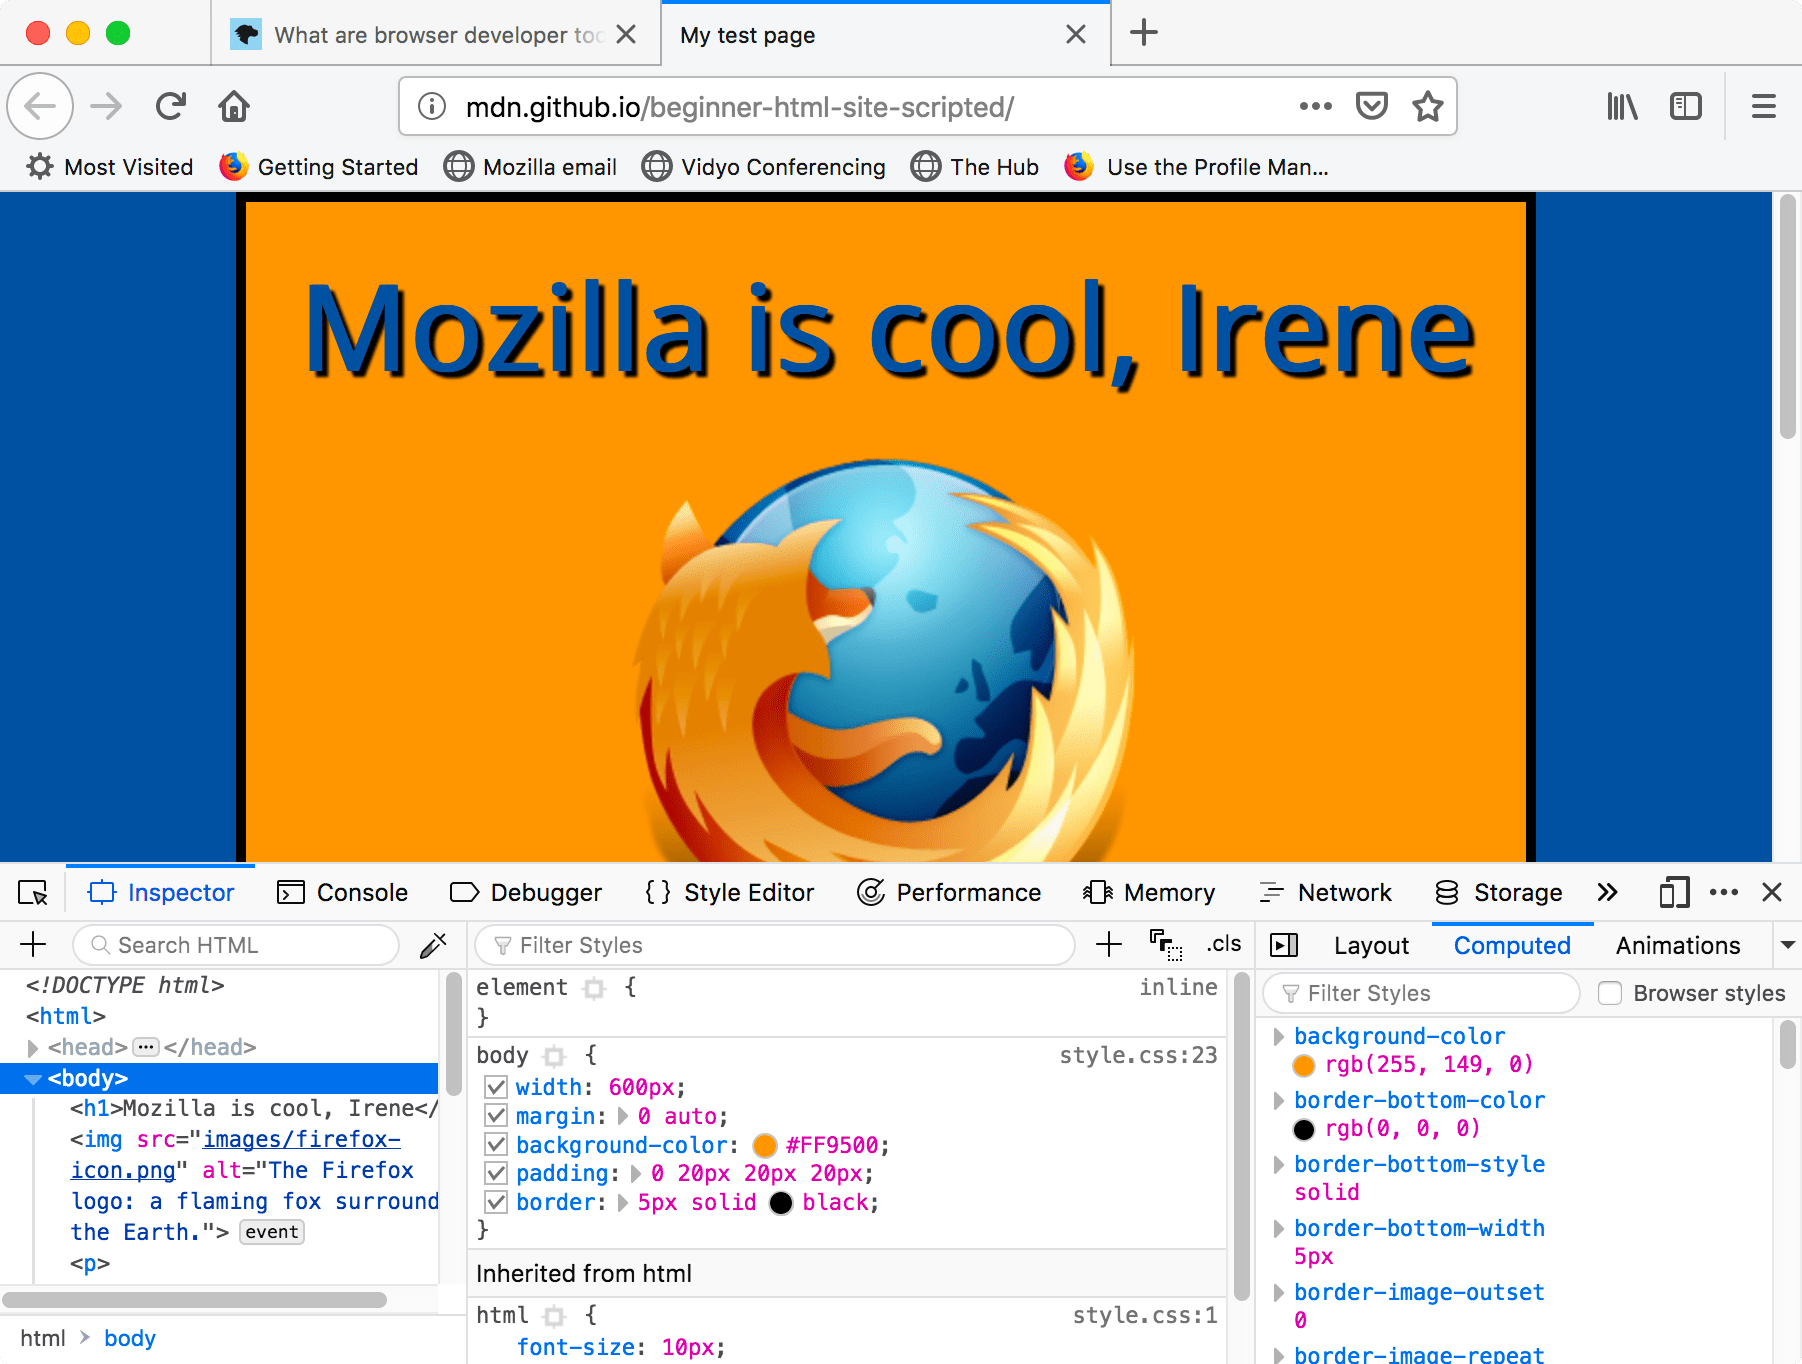
The developer tools usually open by default to the inspector, which looks something like the following screenshot. This tool shows what the HTML on your page looks like at runtime, as well as what CSS is applied to each element on the page. It also allows you to instantly modify the HTML and CSS and see the results of your changes reflected live in the browser viewport.
If you don’t see the inspector,
-Tap/click the Inspector tab.
-In Internet Explorer, tap/click DOM Explorer, or press Ctrl + 1.
-In Microsoft Edge, or Opera, tap/click Elements.
-In Safari, the controls are not so clearly presented, but you should see the HTML if you haven’t selected something else to appear in the window. Press the Style button to see the CSS.
Exploring the DOM inspector
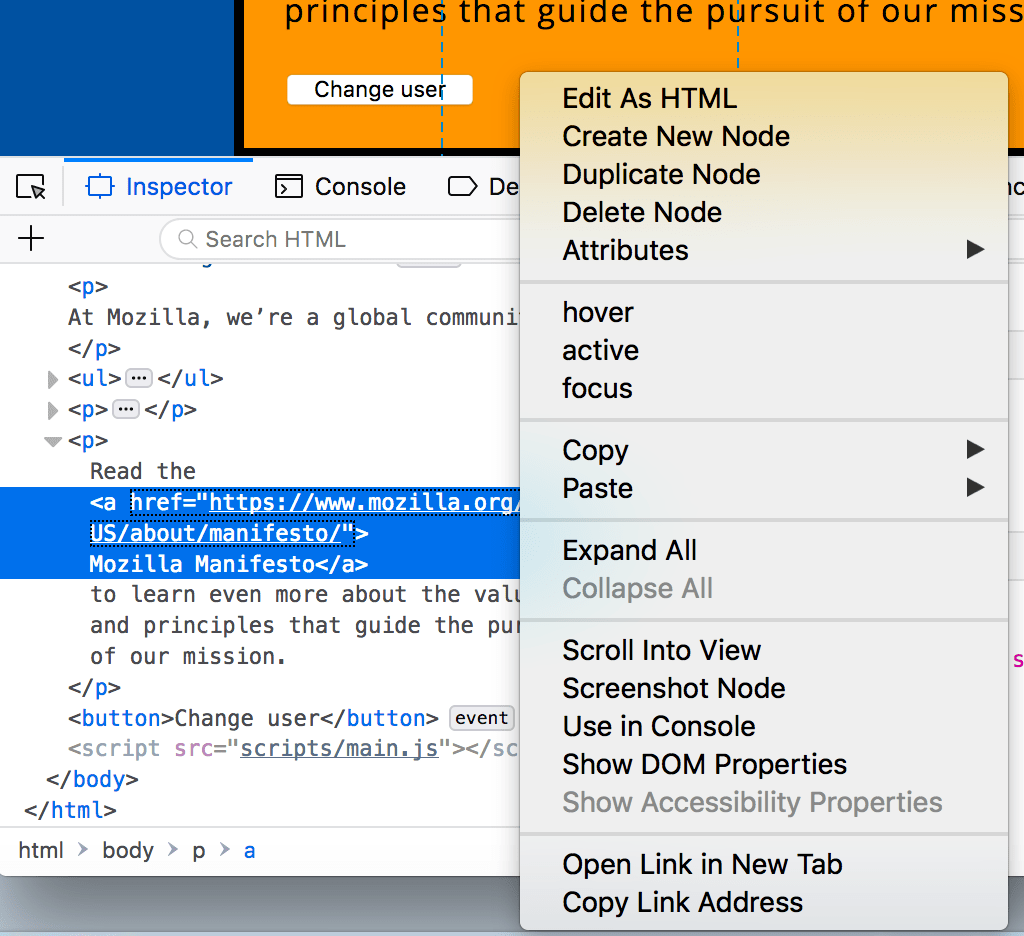
For a start, right-click (Ctrl-click) an HTML element in the DOM inspector and look at the context menu. The available menu options vary among browsers, but the important ones are mostly the same:
Delete Node (sometimes Delete Element). Deletes the current element.
Edit as HTML (sometimes Add attribute/Edit text). Lets you change the HTML and see the results on the fly. Very useful for debugging and testing.
:hover/:active/:focus. Forces element states to be toggled on, so you can see what their styling would look like.
Copy/Copy as HTML. Copy the currently selected HTML.
Some browsers also have Copy CSS Path and Copy XPath available, to allow you to copy the CSS selector or XPath expression that would select the current HTML element.
Try editing some of your DOM now. Double-click an element, or right-click it and choose Edit as HTML from the context menu. You can make any changes you’d like, but you cannot save your changes.
Exploring the CSS editor
By default, the CSS editor displays the CSS rules applied to the currently selected element:
These features are especially handy:
The rules applied to the current element are shown in order of most-to-least-specific.
-Click the checkboxes next to each declaration to see what would happen if you removed the declaration.
-Click the little arrow next to each shorthand property to show the property’s longhand equivalents.
-Click a property name or value to bring up a text box, where you can key in a new value to get a live preview of a style change.
-Next to each rule is the file name and line number the rule is defined in. Clicking that rule causes the dev tools to jump to show it in its own view, where it can generally be edited and saved.
-You can also click the closing curly brace of any rule to bring up a text box on a new line, where you can write a completely new declaration for your page.
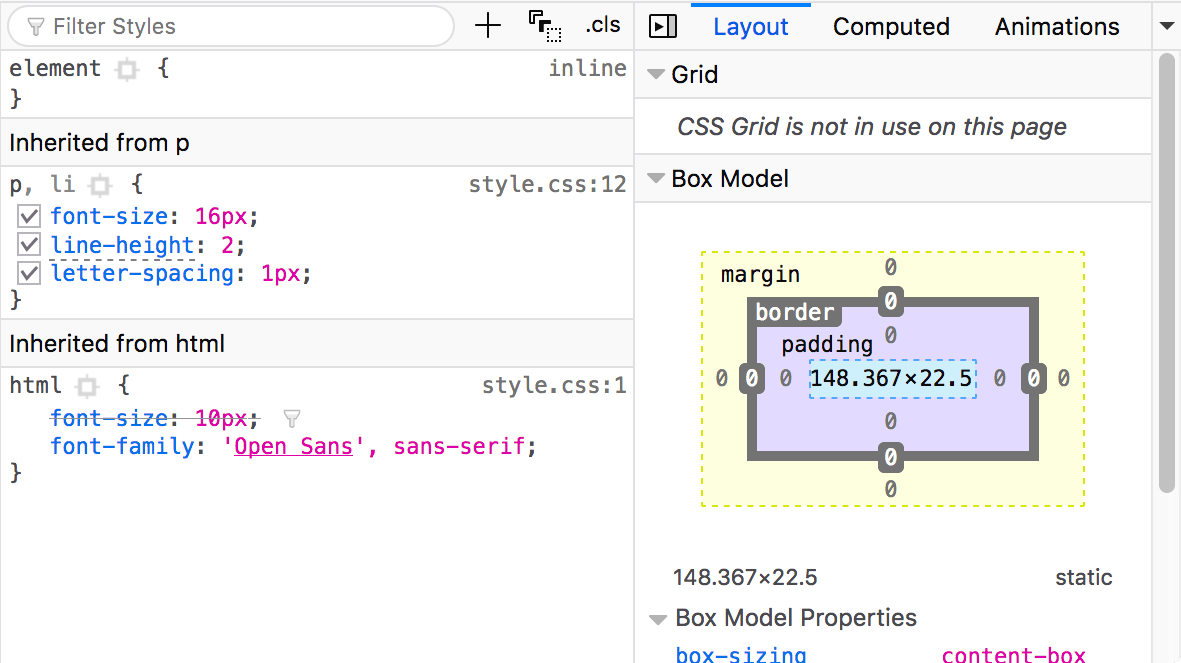
-You’ll notice a number of clickable tabs at the top of the CSS Viewer:
Computed: This shows the computed styles for the currently selected element (the final, normalized values that the browser applies).
Layout: In Firefox, this area includes two sections:
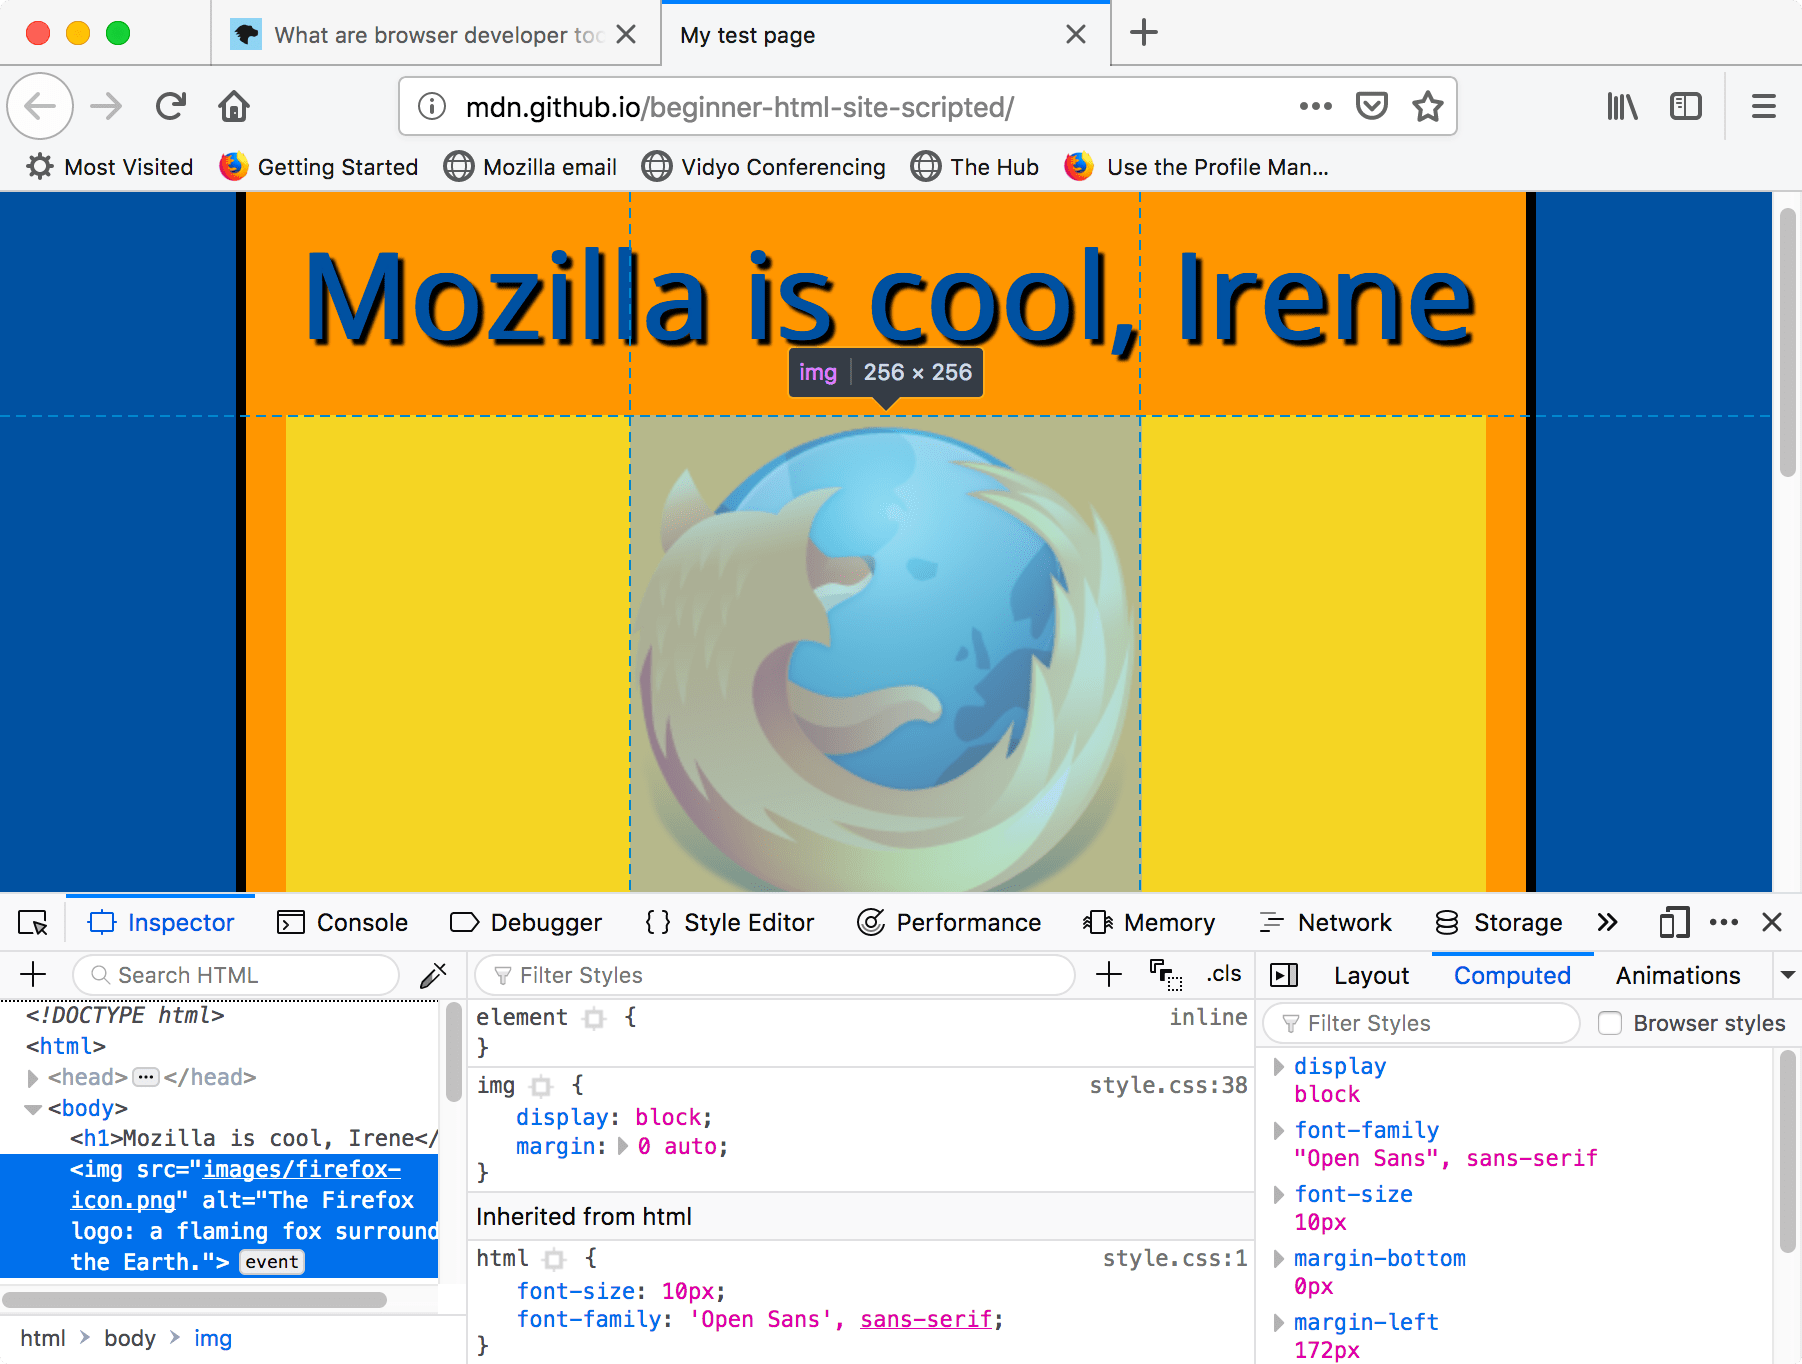
Box Model: represents visually the current element’s box model, so you can see at a glance what padding, border and margin is applied to it, and how big its content is.
Grid: If the page you are inspecting uses CSS Grid, this section allows you to view the grid details.
Fonts: In Firefox, the Fonts tab shows the fonts applied to the current element.
A brief introduction to the dev tools
If you are completely new to dev tools, you should familiarize yourself with them and play around a bit. Pressing F12 would launch the developer tools on most new browsers on a desktop. On chrome, they look something like this:

The Elements tab
The Elements panel (which is shown above, open by default), shows an HTML tree, listing all DOM elements. On the right, the sidebar shows properties related to the presently selected element. By default, the CSS style rules are listed. You can also see the box-model for the element selected, event listeners attached to it, etc.
Network Tab
This tab monitors all incoming and outgoing HTTP requests from the web-page. If your webpage uses AJAX, you can track the AJAX requests as well from here.

Clicking on any request shows further details about it.

Sources Tab
This is probably the most powerful place in the developer tools. Explaining each and every function of this tab is not possible in one article, but here is an overview.The sidebar shows the directory listing of all the static resources loaded for the webpage presently open. Clicking on any one will open that resource in the File Area.

The sidebar on the right is for JavaScript inspection. By clicking on a line number, you can add a breakpoint for that line of the script open in the file area. When that line is about to be executed, script execution will be paused.
For ease of use, you can hit the Esc key to toggle the split console drawer, which allows you to see the console (and some other tabs) together with any of the main tabs.

So, say you want to inspect a variable defined in the function. You can’t do that directly, since it is not available in the global scope, but you can do this by adding a break-point at the function declaration. When the function is about to be executed, the debugger will be invoked, and you step through the lines one by one, by clicking the “Step over next function call” button.

During this, all the variables accessible on that line would be accessible from the console, and would also be listed in the Scope Variables section on the right sidebar.
Resources
This tab will list the different resources a webpage saves on the computer. Like localStorage, sessionStorage, cookies, etc.

You can even edit the resources right from the dev tools, in real-time. This is useful for debugging Single Page Applications that save a lot of data like config etc. in localStorage, or a cookie heavy site.
The console
The console serves the purpose of a log file, as well as an open playground.
You can type any command in the console and then hit enter. Whatever the return value of the command is will be printed in the console.

Workflow
These are some little hidden gems in the developer tools, which are otherwise overlooked.
Find in styles
While inspecting the CSS style rules for an element on a page with a lot of styles, you might get frustrated. However, you can filter the style rules easily.

DOM Breakpoints
If you are doing a lot of DOM manipulation, and something is not working as expected, you can add breakpoints directly to the DOM elements! Just right click on the element in the Elements panel, select Break on, and check the options at which you want the script to break.

Now whenever changes are made to that DOM element, the script execution will be paused, and the debugger will be invoked, allowing you to inspect the state of the application, and identify the problem(s).
Pause script execution
Hitting F8 while dev tools are open would immediately pause any scripts running. This is helpful when you have async code running, or JavaScript animations running.

Other than this, breakpoints let you inspect all variables at the current execution frame from the console, which allows you to access variables and functions which are otherwise hidden from the global scope.
Snippets
Snippets are the advanced version of the console. Snippets allow you to write multi-line JavaScript code, save them in the dev tools memory (they are preserved forever, until you delete them), have a git style version history (!), have smart code auto-completion, syntax highlighting, and what not! They utilize the same power of break-points too!
To use snippets in chrome developer tools, open the sources tab. On the sidebar on the left, click on the Snippets tab, and right click and create a new snippet. Give it a new name, if you like. And start writing your code!
Customers who are looking for a secured Developers Win 2012R2-VS 2015JDK 7-AndroidStudio-NetBeans with IIS,PHP and FTP installation which takes care of secured Developers Win 2012R2-VS 2015 JDK 7-AndroidStudio-NetBeans installation and not putting everything on ephemeral disk can use this specially designed image.The respective trademarks mentioned in the offering are owned by the respective companies.

Snippets are really great for prototyping. A similar thing called “Scratchpad” exists for Firefox, giving the same functionality.
Workspaces
Workspaces in chrome dev tools allow you to work on the code on your file system directly from the dev tools, and make persistent file changes, while utilizing the full power of break-points, call stack etc.To use workspaces, simply right click on the sidebar at the left of the Sources tab, and select “Add Folder to Workspace”, and follow through the guide.

Pretty-print code directly from dev tools: If you want to inspect some minified (compressed code, resulting in unreadable code for humans), you can pretty print the code from the dev tools.

Inspecting <iframes> from the console
If one of your scripts are in an iframe, which you wish to inspect in the console, you might find that directly typing the variable names defined for the iframe won’t work.For instance, if you have an iframe in your page, and the iframe contains an element with the id xyz, then typing document.getElementById(‘xyz’) in the console directly won’t give the element, because the document would refer to the parent page.You might have encountered this if you have used JSFiddle. But you can change the window frame you are inspecting from the console.

The console API
The console has a very nice API, specially for webkit based browsers like Chrome. Here are 5 quick tips for the Chrome Web Console:
- $ is an alias to document.querySelector, and $$ is an alias to document.querySelectorAll.
- ) $0, $1… $4 give reference to the last 4 DOM elements selected from the DOM inspector. (So when you have to select an element, right click, and inspect element, then type $0 in the console!)
- $_ holds the value for the last expression evaluated in the console. Useful when you are running a lot of expressions simultaneously. (Chrome Only).
debug(function), typing this in the console would watch for the function passed as the first parameter to be called. 4.When it is called, the debugger will be invoked, and the script would be paused. (Chrome only).
getEventListeners(domElement) would list all the event listeners attached to the DOM element. (Chrome only).
In computer programming, Eclipse is an integrated development environment (IDE). It contains a base workspace and an extensible plug-in system for customizing the environment. Eclipse is written mostly in Java and its primary use is for developing Java applications, but it may also be used to develop applications in other programming languages through the use of plugins, including: Ada, ABAP, C, C++, COBOL, Fortran, Haskell,JavaScript, Julia, Lasso, Lua, NATURAL, Perl, PHP, Prolog, Python, R, Ruby (including Ruby on Rails framework), Rust, Scala, Clojure, Groovy, Scheme, and Erlang. It can also be used to develop packages for the software Mathematica.
Developer Tools on cloud for AWS
Features
Google Chrome is a popular browser among front end developers, and with its robust developer tools, it’s not hard to see why. But with such a broad selection of features, it’s easy for developers to gravitate to familiar favorites and miss out on lesser-known tools that make debugging faster and easier.
Here are a few of the most useful tips and features:
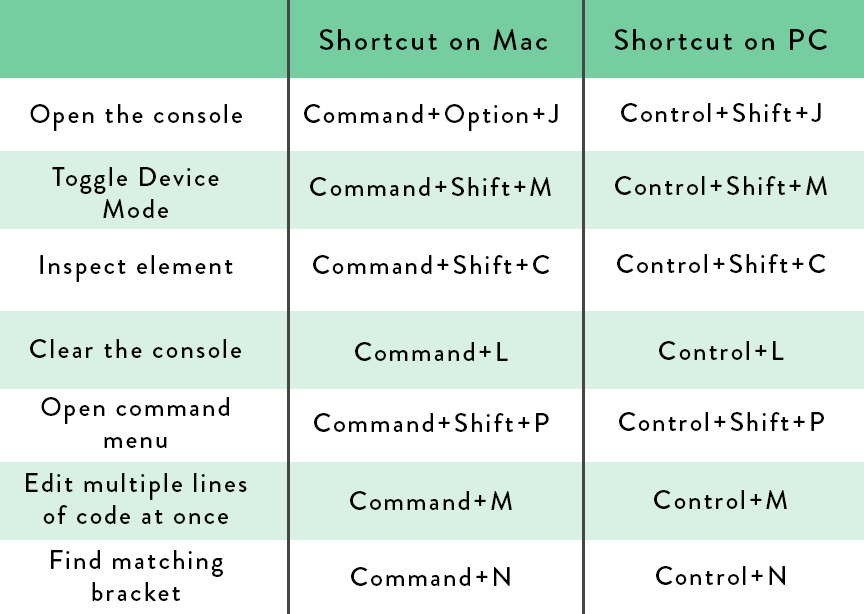
1. Open Chrome DevTools with Control+Shift+I, and Other Helpful Shortcuts
There are a few ways to access the DevTools. The first is opening the Chrome menu in the browser window, then clicking on “More Tools” and then “Developer Tools”. A faster way is right-clicking anywhere on the page (or Command-clicking on a Mac) and then selecting “Inspect”, which will bring up the element you clicked on in the Elements tab in the DevTools. The fastest way, however, is through a keyboard shortcut: Control+Shift+I on a PC, and Command+Option+I on a Mac. There are also several other helpful shortcuts to know:
2. Add Reverse Breakpoints in the Elements Tab
If you’re debugging a page and suspect that a specific element is the cause, your first instinct may be to go to the Sources tab. But it’s also possible to create a breakpoint in reverse, by selecting the element rather than the line of code. This can be especially useful if an element is disappearing or appearing when you don’t expect it, and your code modifies multiple parts of the DOM, making it hard to see where exactly something is going wrong. A DOM breakpoint lets you get to the source of the problem directly.
To create a DOM breakpoint, use the element inspector (the arrow icon in the top-left corner of the DevTools) to click on, or inspect, a part of the page. Then right-click (or Command-click on a Mac) on the highlighted line of code and select “Break on…”. You’ll see three options.
–Subtree modifications will trigger when a child of the selected element is removed or added, or when a child’s content is changed.
–Attribute modifications will trigger when an attribute of the selected element is removed or added, or when its value is changed.
–Node removal will trigger when the selected element is removed.
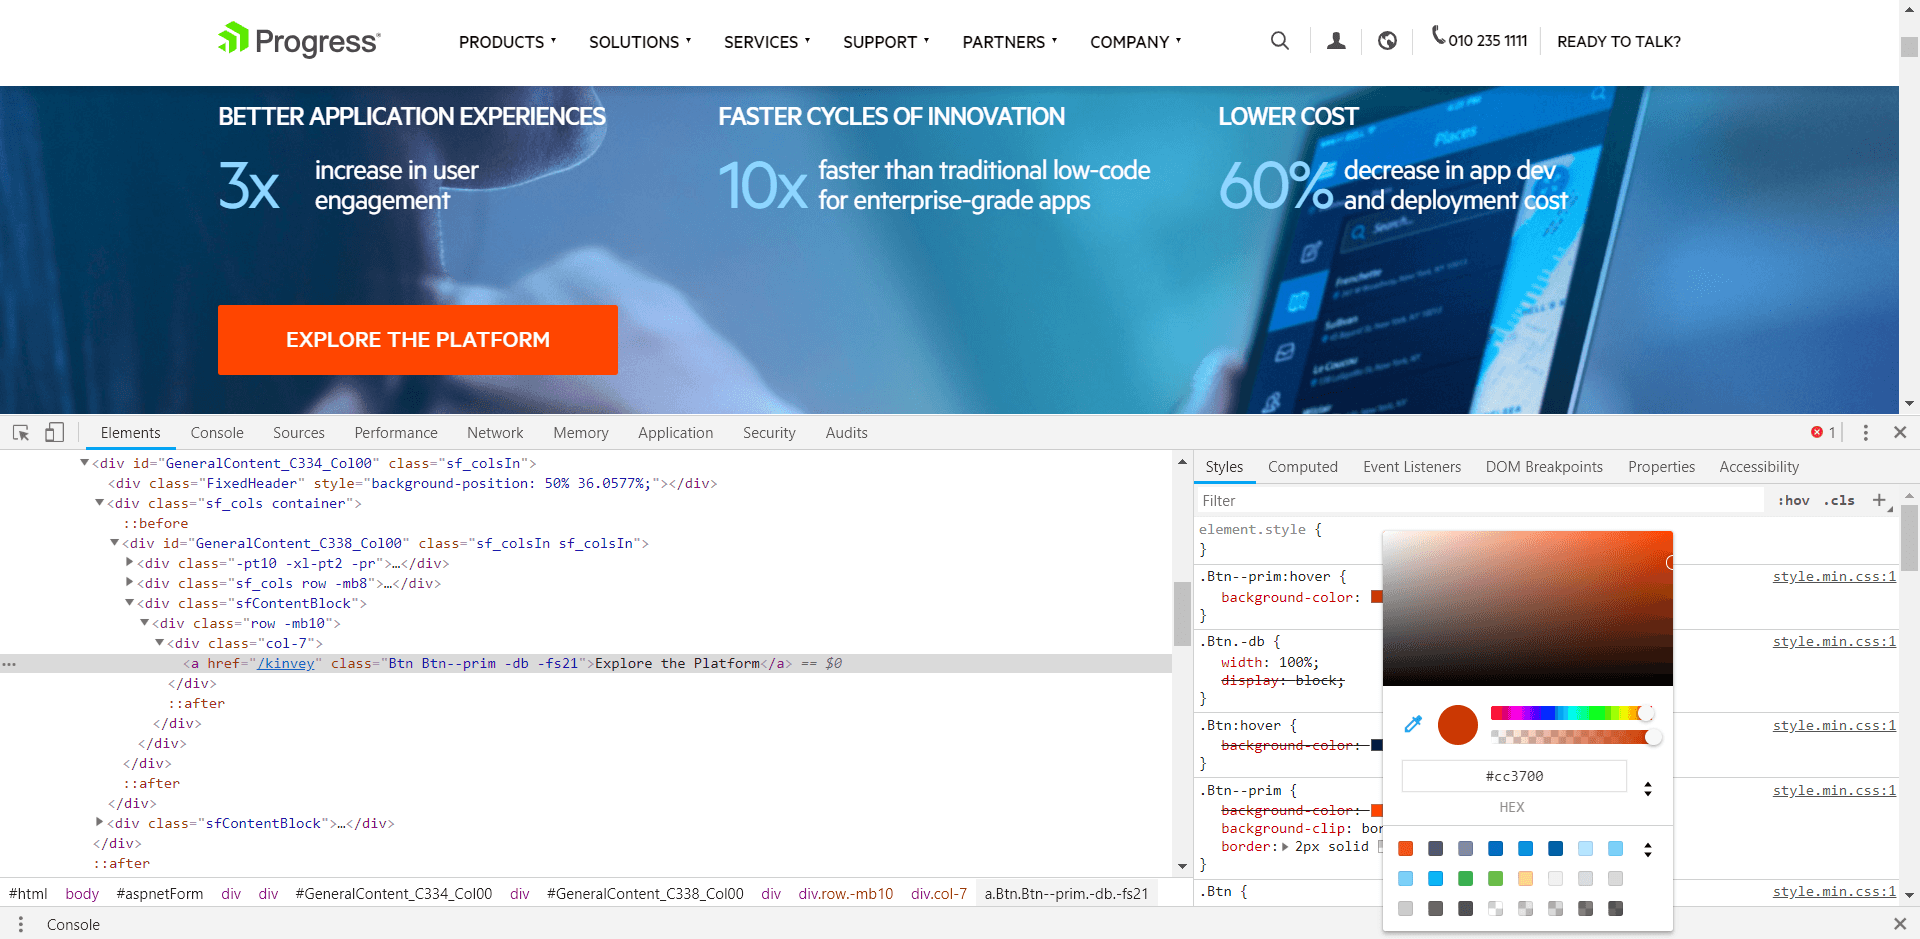
3. Open a Color Picker or Change the Color Format in the Elements Styles Tab
If you’ve selected an element that has a color attribute, that color will be visible in the bar on the right side of the elements tab. You can toggle styles for your inspect element on or off using the checkboxes, or edit them by double-clicking on them. For a color attribute, it’s also possible to open a color picker by double-clicking on the colored square next to the attribute. If you’d like to use a color from the page’s existing color palette, Chrome makes it easy; just click on the arrows to the left of the color palette and use colors from the Page Colors palette. Finally, if you’d like to see the color in a different format, by switching between hex and RGBA, for example, you can do so by Shift-clicking on the color square.
4. Access an Inspect Element in the Console Using the Temporary Variable $0
If you want to select an element in your console tab, you can avoid getting messy with document.getElementByID. Use the element inspector in the Elements tab to select the node, then click over to the Console tab and use the temporary element $0. You can also select the parent element using $1, and its parent using $2, etc.
5. Monitor Events on a Specific Element Using monitorEvents() in the Console
To monitor events on one node or element, you can use your console. The monitorEvents() function takes an HTML ID, and can also take specific kinds of events. For example, to monitor all events that happen to the document body, you could use monitorEvents(document.body), or to monitor only clicks on the body, use monitorEvents(document.body, ‘click’); the console will log the event object, so you can see its properties. You can also combine this with the last trick by first selecting an element using the element inspector, then typing monitorEvents($0). Use unmonitorEvents(document.body) to stop.
6. Set a Breakpoint at the Start of a Function Using the Console
If you’re interested in debugging a specific function, it’s possible to do so in the console itself. This can save time if you’re in a rush and don’t want to hunt down a specific function in your Sources panel, or when you don’t have the source files (for example, if you created the function in the console in the first place). Use the debug() function, passing your selected function’s name to debug() as an argument, like this: debug(myFunctionName). To remove the breakpoint, use undebug(myFunctionName).
7. In the Network Tab, See a Request’s Initiators and Dependencies By Holding Shift
To see the initiators and dependencies of a specific request, you can use the Network tab. In the tab, click on a request in the request table and hold Shift; initiators are highlighted green, and dependencies are highlighted red. You can read more in the official documentation.
8. Add Conditional Breakpoints Using Right-Click
It’s possible to create conditional breakpoints, which only fire when a certain condition is met. This can be very useful in debugging situations in which you have multiple breakpoints but are only interested in stepping into a function under some conditions, such as when a certain variable is true. To do this, create the breakpoint as you would normally, by clicking on the line number you’d like to break on in your Sources panel. Then right-click (or Command-click on a Mac) on the breakpoint and select ‘Edit breakpoint.’ Write a condition in the box that pops up, such as myVar == true; the breakpoint will only fire when that condition is met.
9. Add a Breakpoint Midline by Entering the Line
Sometimes it’s useful to break on a certain part of a line, rather than on the line itself. This can save time that would be spent stepping into each part of the code on that line, or, more importantly, break on one-line callback functions, such as on doSomething in the following function: setTimeout(() => { doSomething(a, b); }, 1000).
To create a midline breakpoint, go to your chosen line of code in the Sources panel. Click on the part of the line you’d like to break on, as though you want to edit the text. Then, click on the line number to create a breakpoint. You’ll see several smaller, gray breakpoint arrows appear, each at a different part of the line. Click on the one at the point in the line where you’d like to break to establish your midline breakpoint.
10. Evaluate Expressions and Variables When the Page is Paused
This tip is one of the most useful I’ve encountered for debugging. When your page is stuck on a breakpoint, you can see the current value of any expression or variable on the page by hovering over it. For combined expressions, select the whole or partial expression first, then hover over it.This is especially useful when one of your variables isn’t returning the way that it should, because you can track, at each step of a function or line of code, what the value of the variable is and when it changes. While this tip may be the simplest to use, it’s possibly the most useful for frustrating debugging scenarios.
Major Features of Developers win :
- Code editor
- Debugger
- Designer
- Windows Forms Designer
- WPF Designer
- Web designer/development
- Class designer
- Data designer
- Mapping designer
AWS
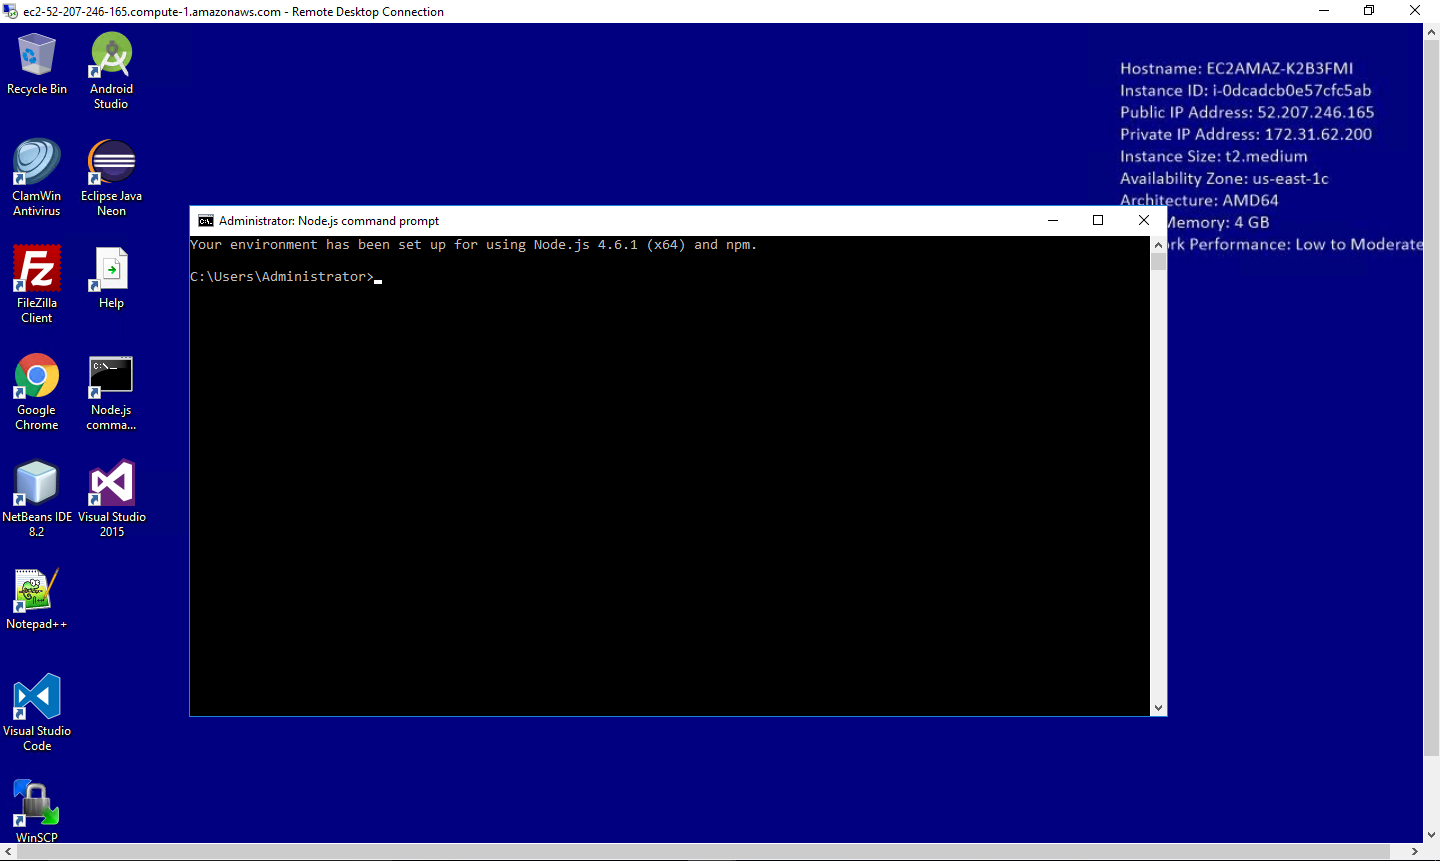
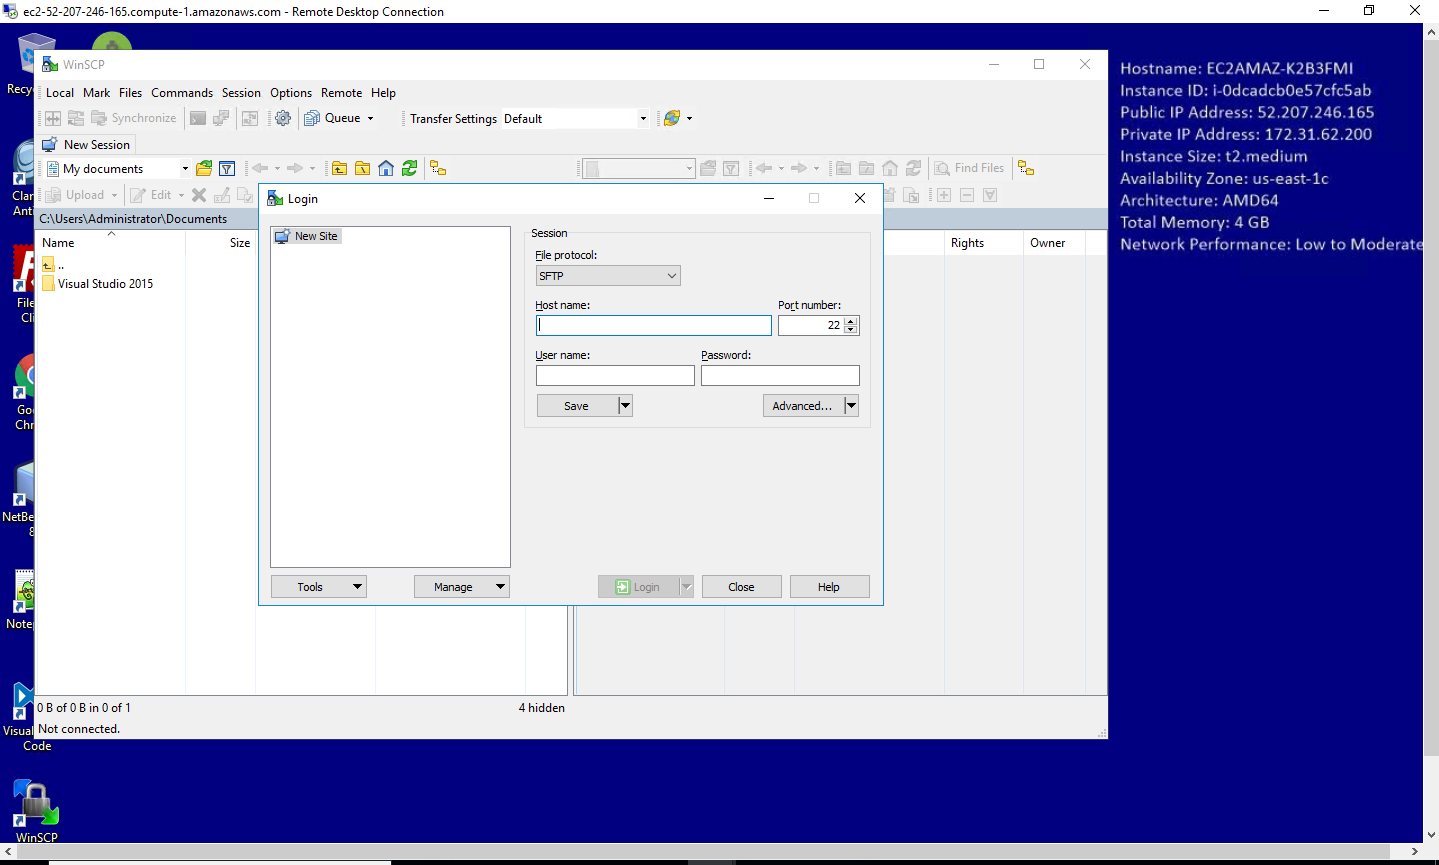
Installation Instructions for Windows
Step 1) RDP Connection: To connect to the deployed instance, Please follow Instructions to Connect to Windows instance on AWS Cloud
Connect to the virtual machine using following RDP credentials:
- Hostname: PublicDNS / IP of machine
- Port : 3389
Username: To connect to the operating system, use RDP and the username is Administrator.
Password: Please Click here to know how to get the password .
Step 2 ) Other Information:
1.Default installation path:
a) Visual Studio Community 2015 – ” C:\Program Files (x86)\Microsoft Visual Studio 14.0″
b) JDK Path – “C:\Program Files\Java”
c) NodeJS path – “C:\Program Files\nodejs”
d) Android Studio Path – “C:\android-sdk\”
e) IIS Path – “C:\Windows\System32\inetsrv”
2.Default ports:
- Windows Machines: RDP Port – 3389
- Http: 80
- Https: 443
Configure custom inbound and outbound rules using this link
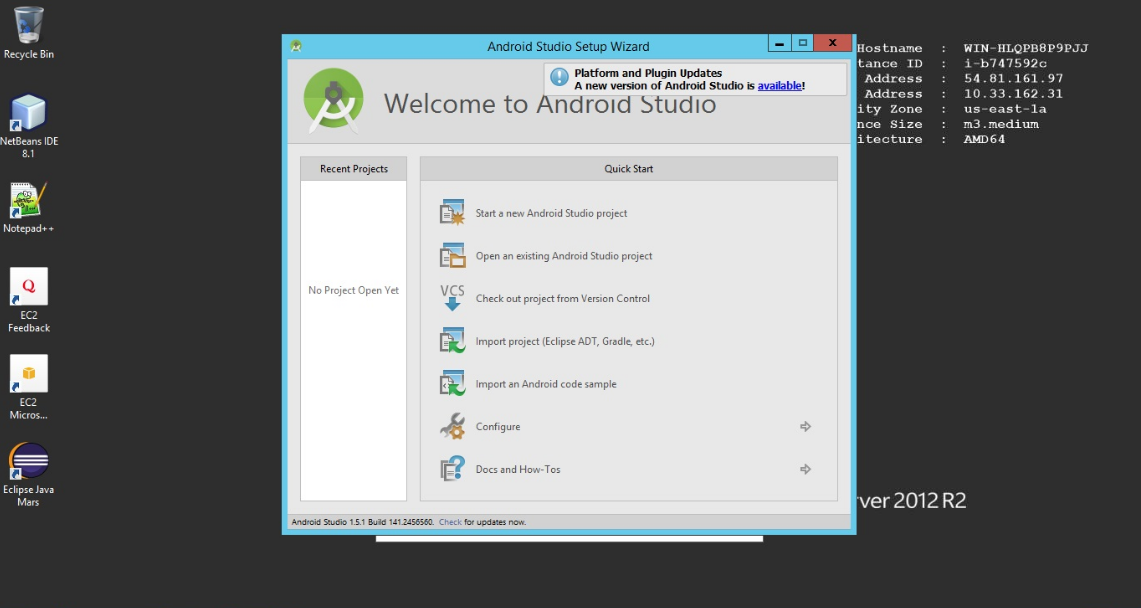
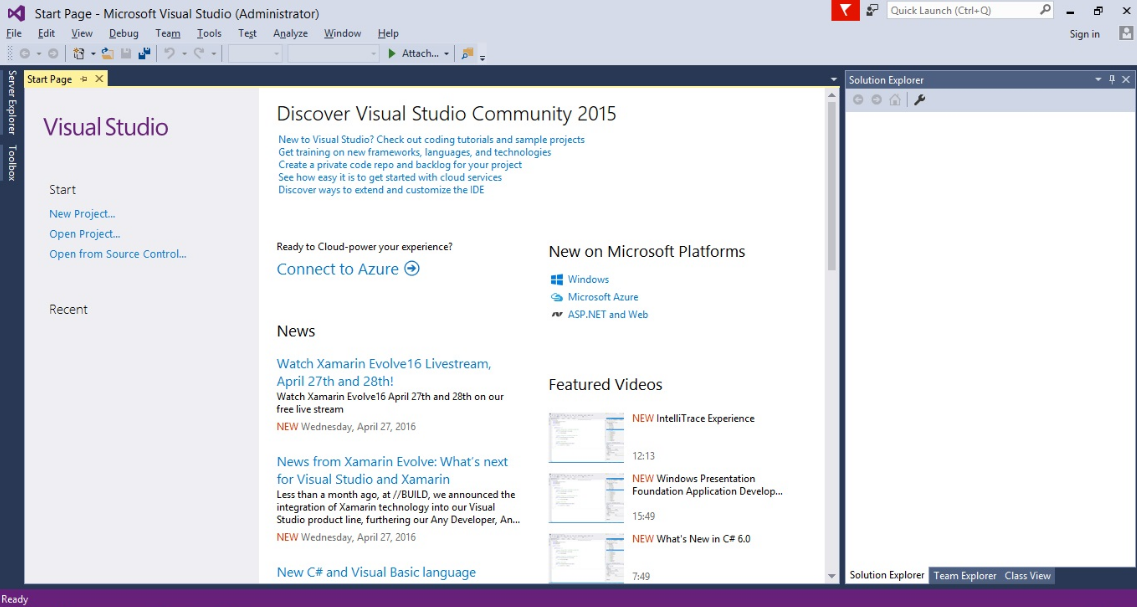
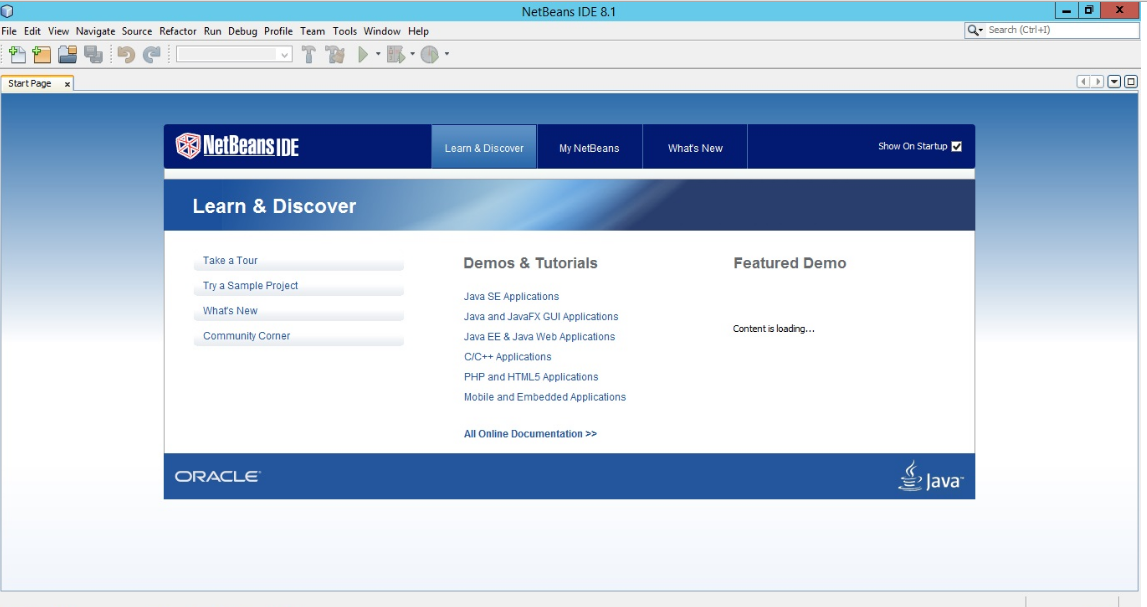
Installation Step by Step Screenshots


Videos
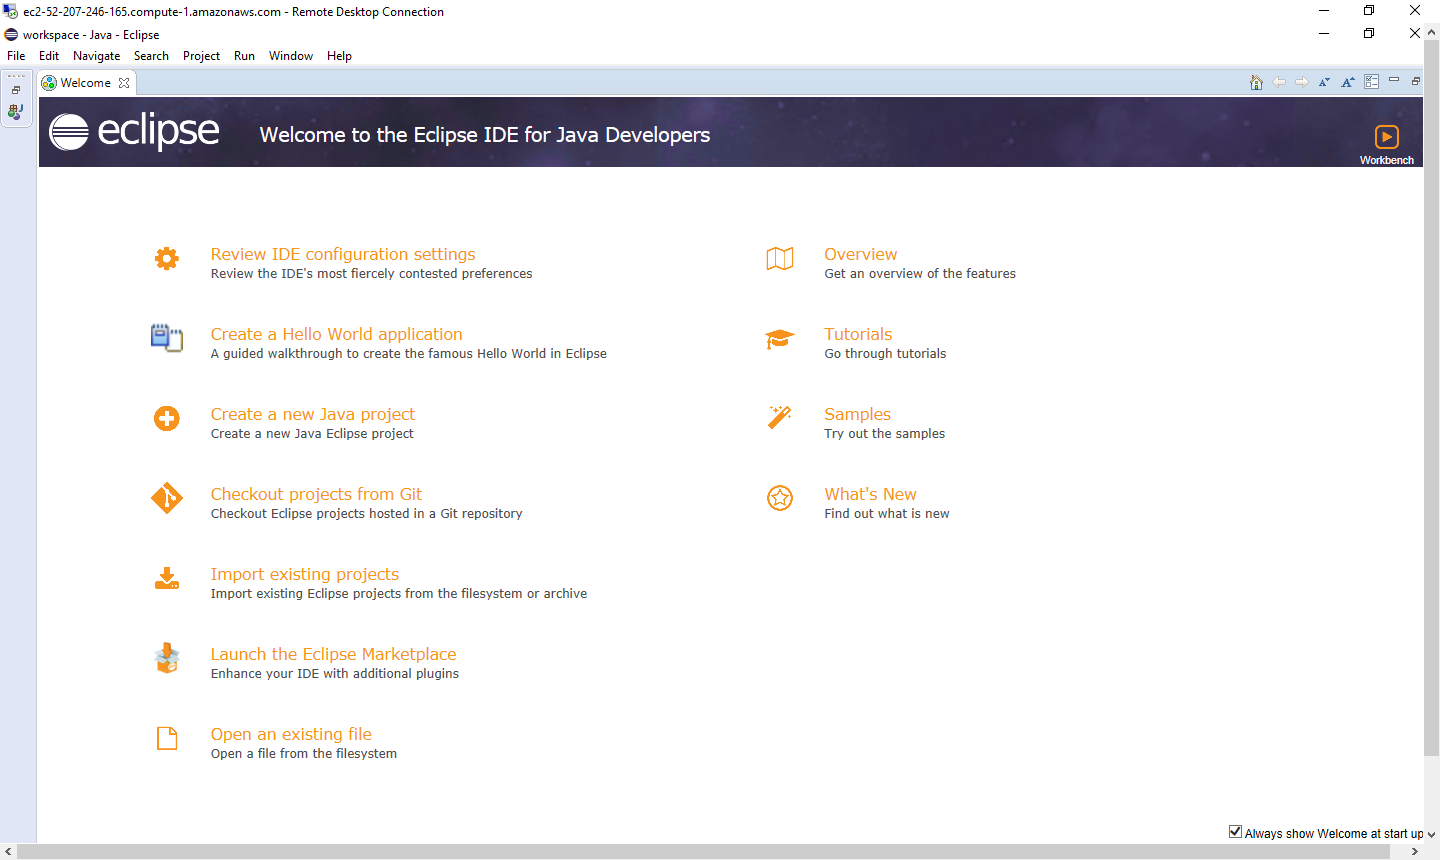
How to install Eclipse IDE Java on Windows
Visual Studio Overview and Layout